
97% of Australian Suburbs Are Falling — What Happens Next? | APS176
Cotality’s September data shows home values falling in 97% of capital city suburbs, up from 93% in August. Even in the spring selling season, the market has gone colder. Seven of the eight capitals are falling, and after six months of declines, national values are 5.2% below the March peak. Then on September 29, the RBA hiked again to 4.6%, the highest cash rate in 15 years. So will rates keep rising, when will the first cut come, and when will prices bottom out? There's a lot to get through today, so watch to the end, and you'll see the pattern behind this year's four hikes.
September’s continued decline
How bad did September actually get, and where are prices heading from here?
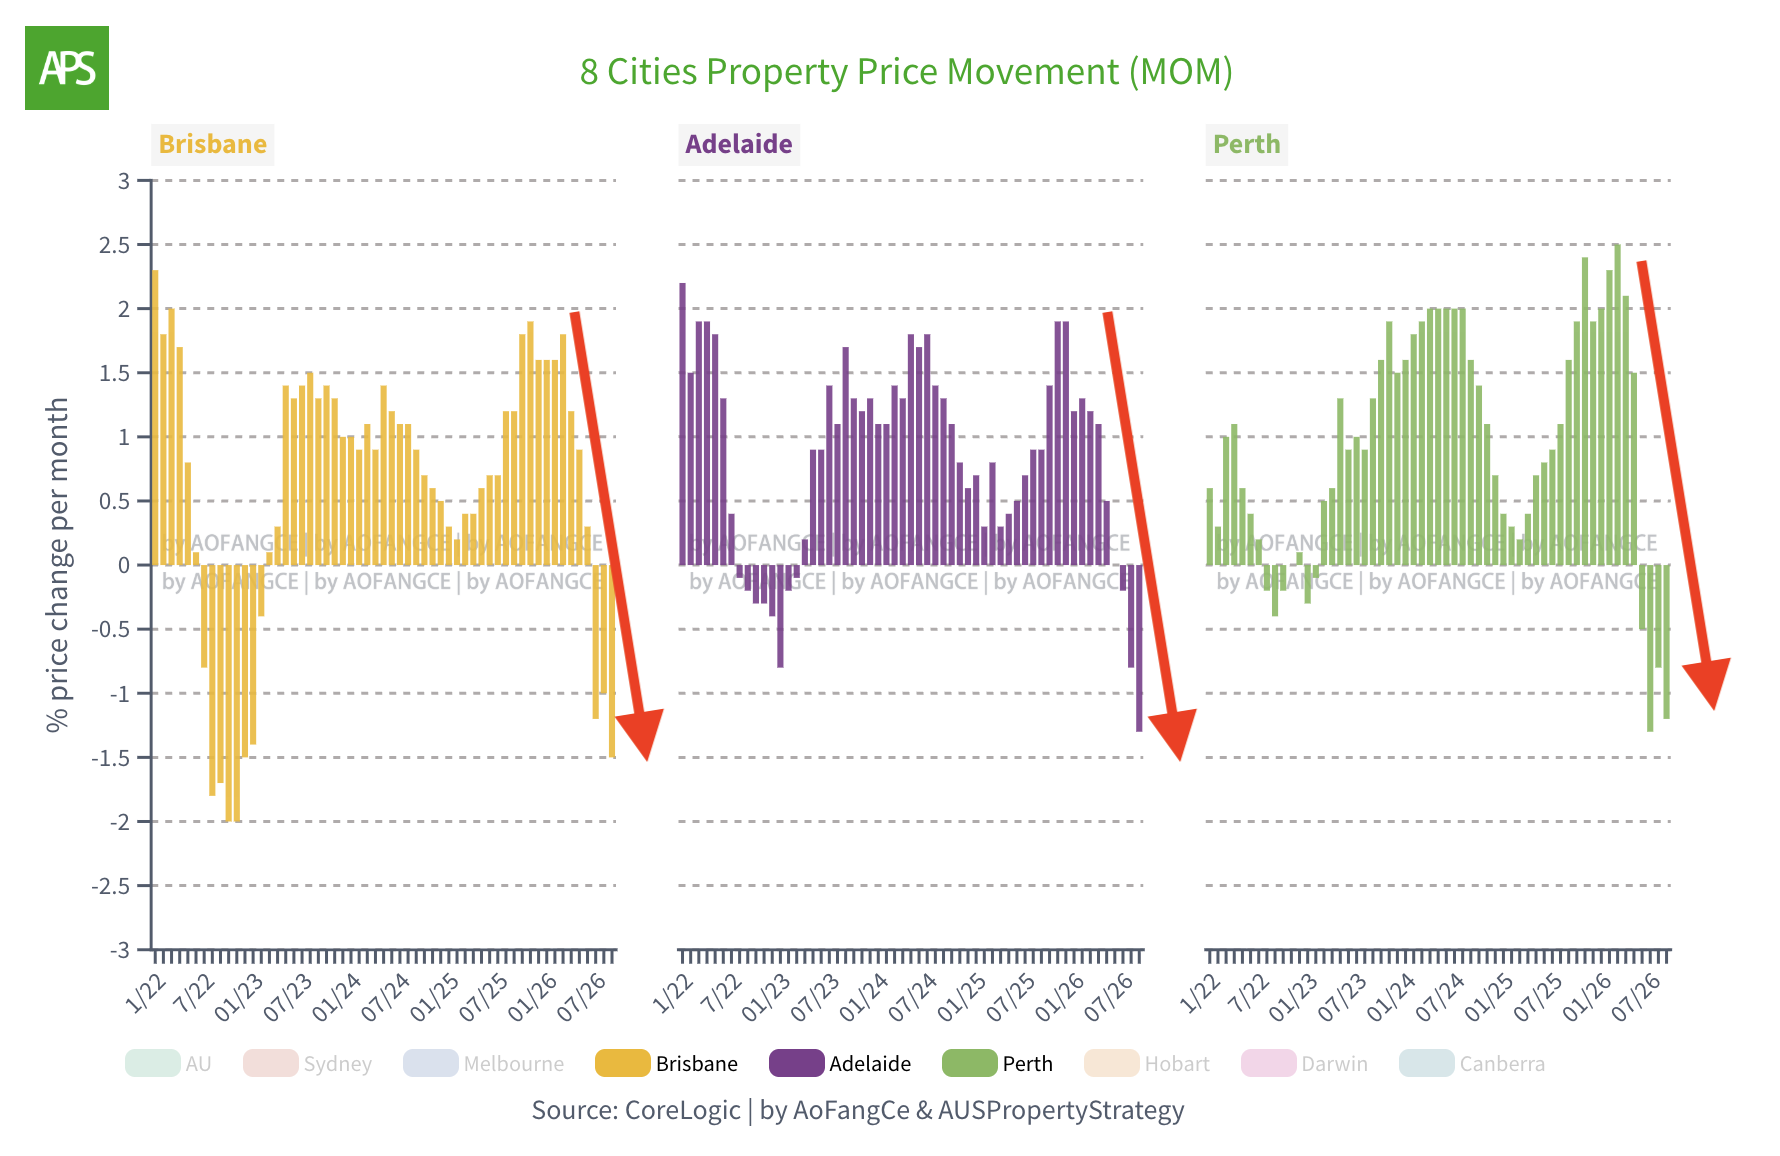
Cotality’s national home price index fell 1.1% in Septemaber. August was 0.9%, so the rate of decline is picking up speed. From the March peak, national prices are down 5.2%, and year-on-year growth sits at exactly zero. If you bought at the start of the year, on paper you haven’t made a cent.
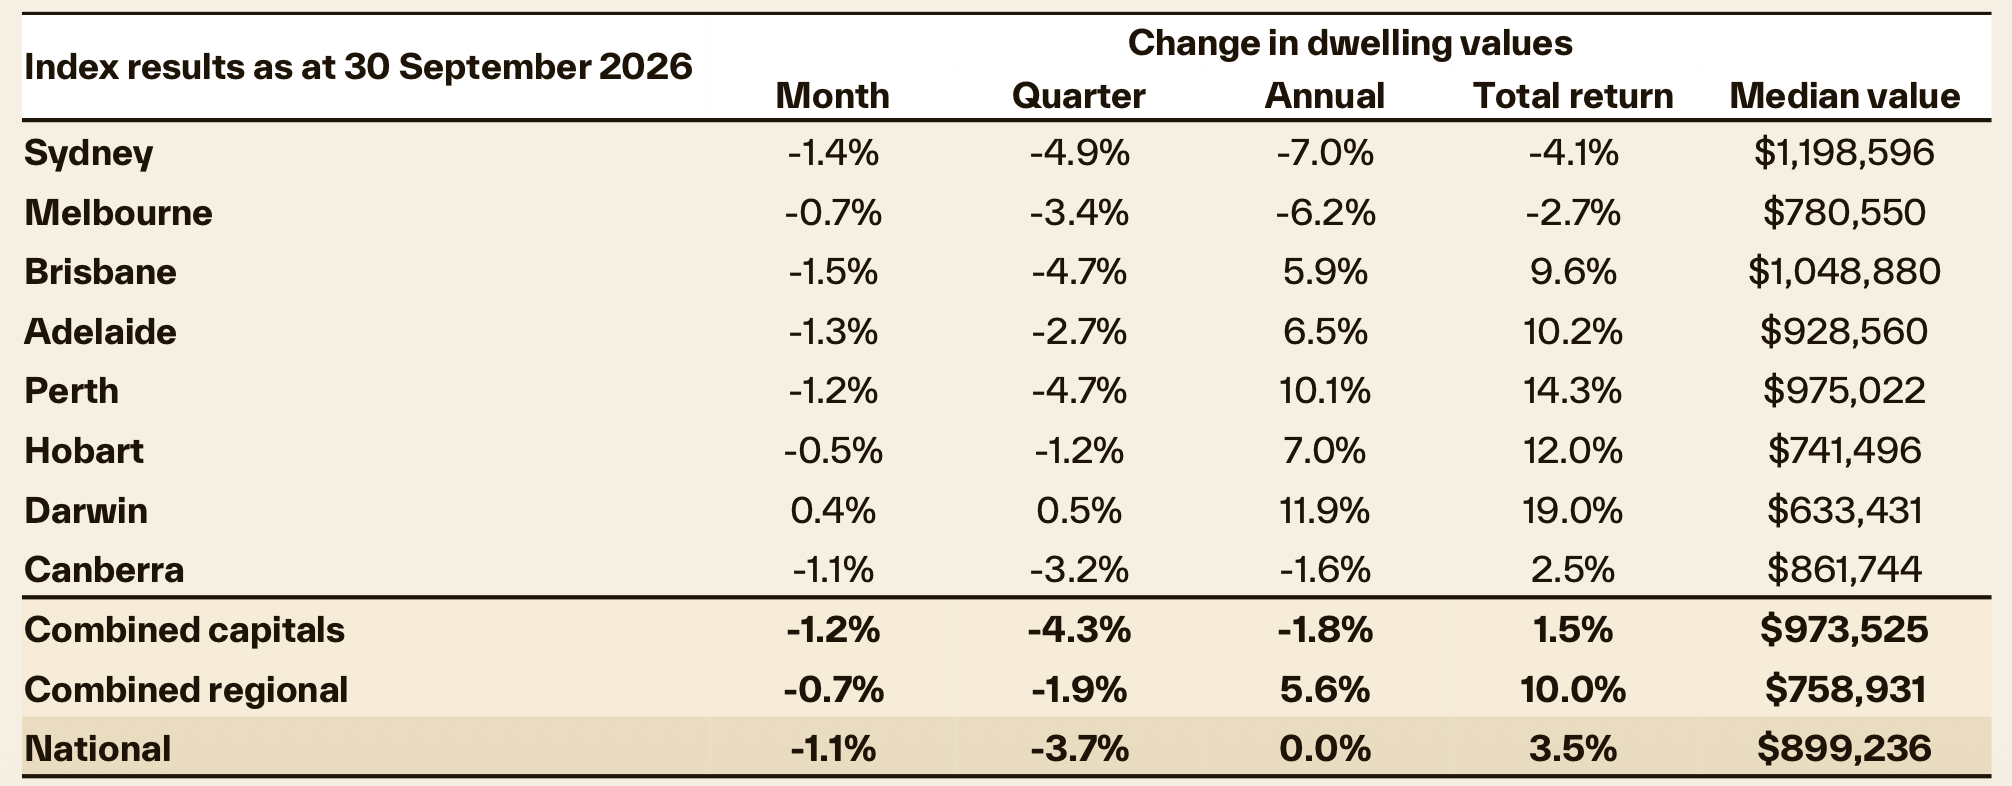
Sydney dropped 1.4% and is now 8.6% below its February peak. Cotality notes this downturn is already steeper than the 2022-2023 cycle at the same point in time. Melbourne fell 0.7%, the softest among capitals, but sits 7.2% below its November high last year.
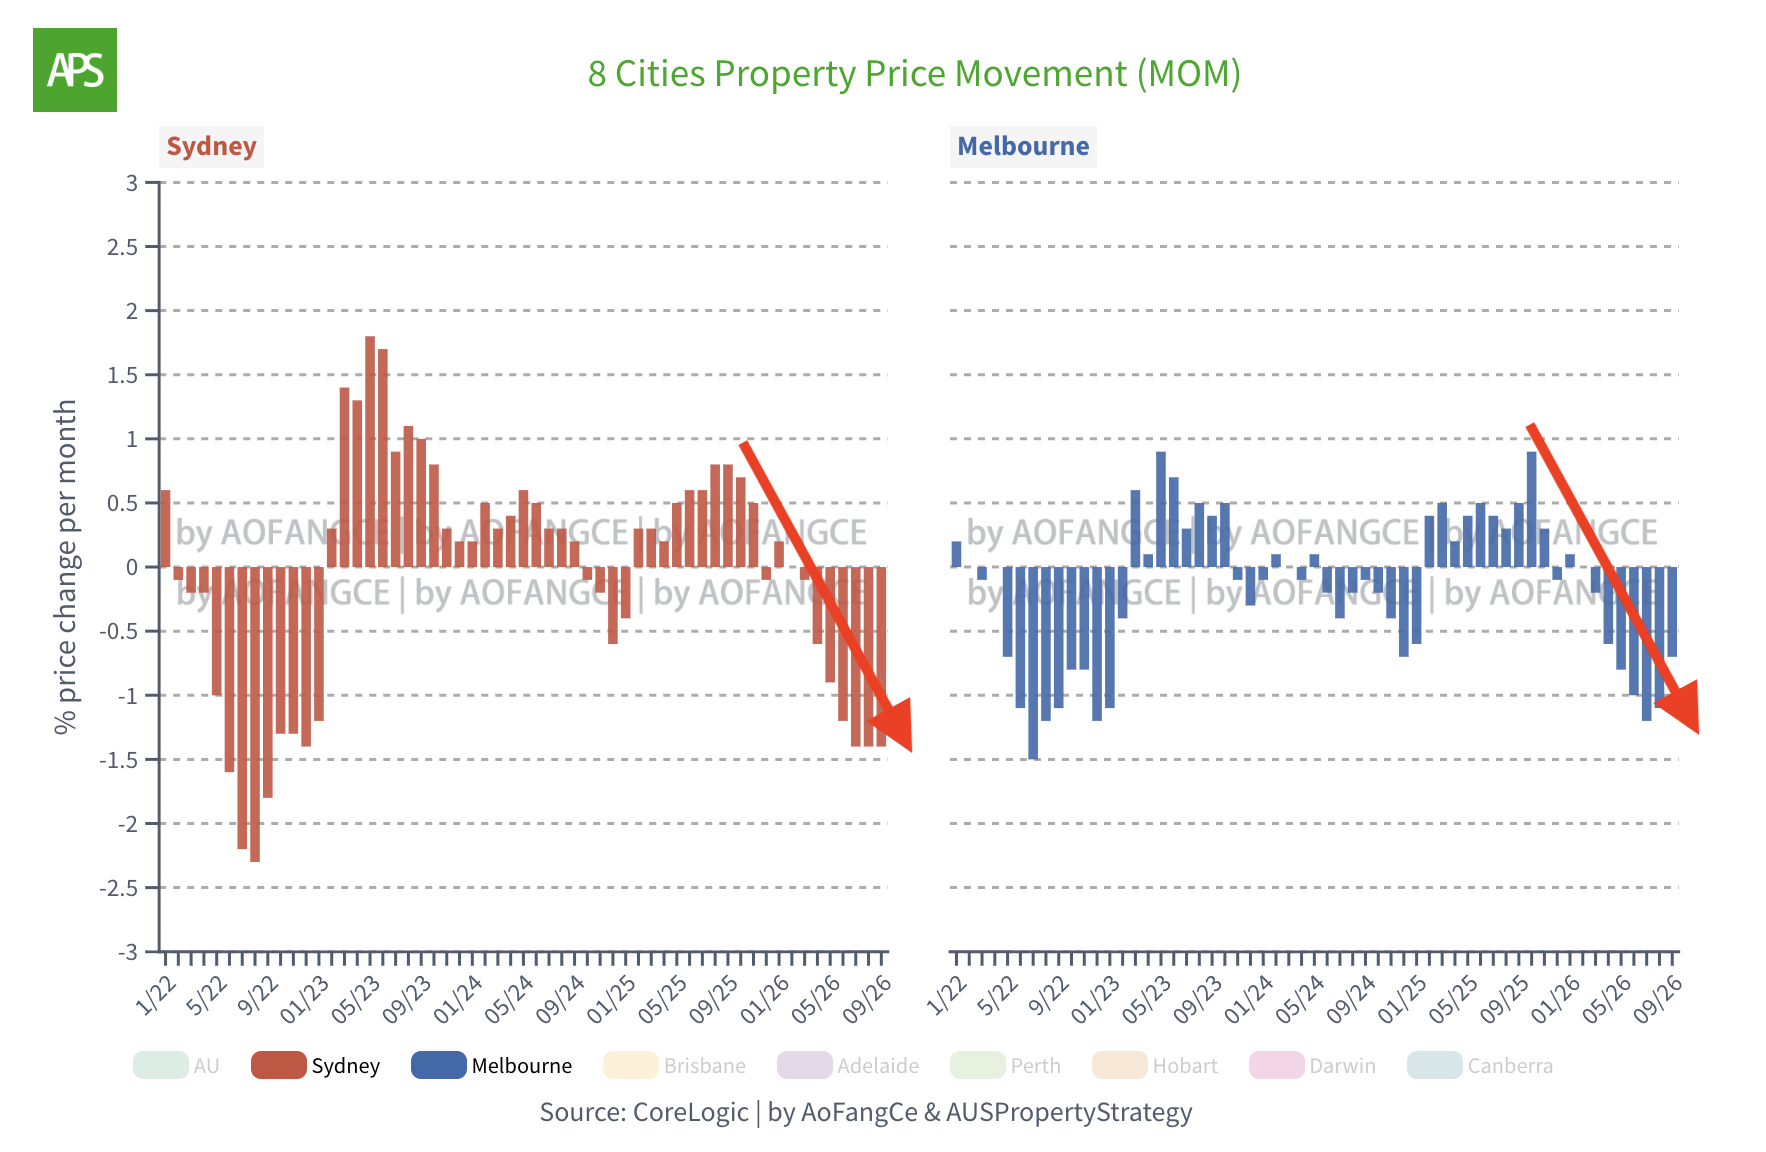
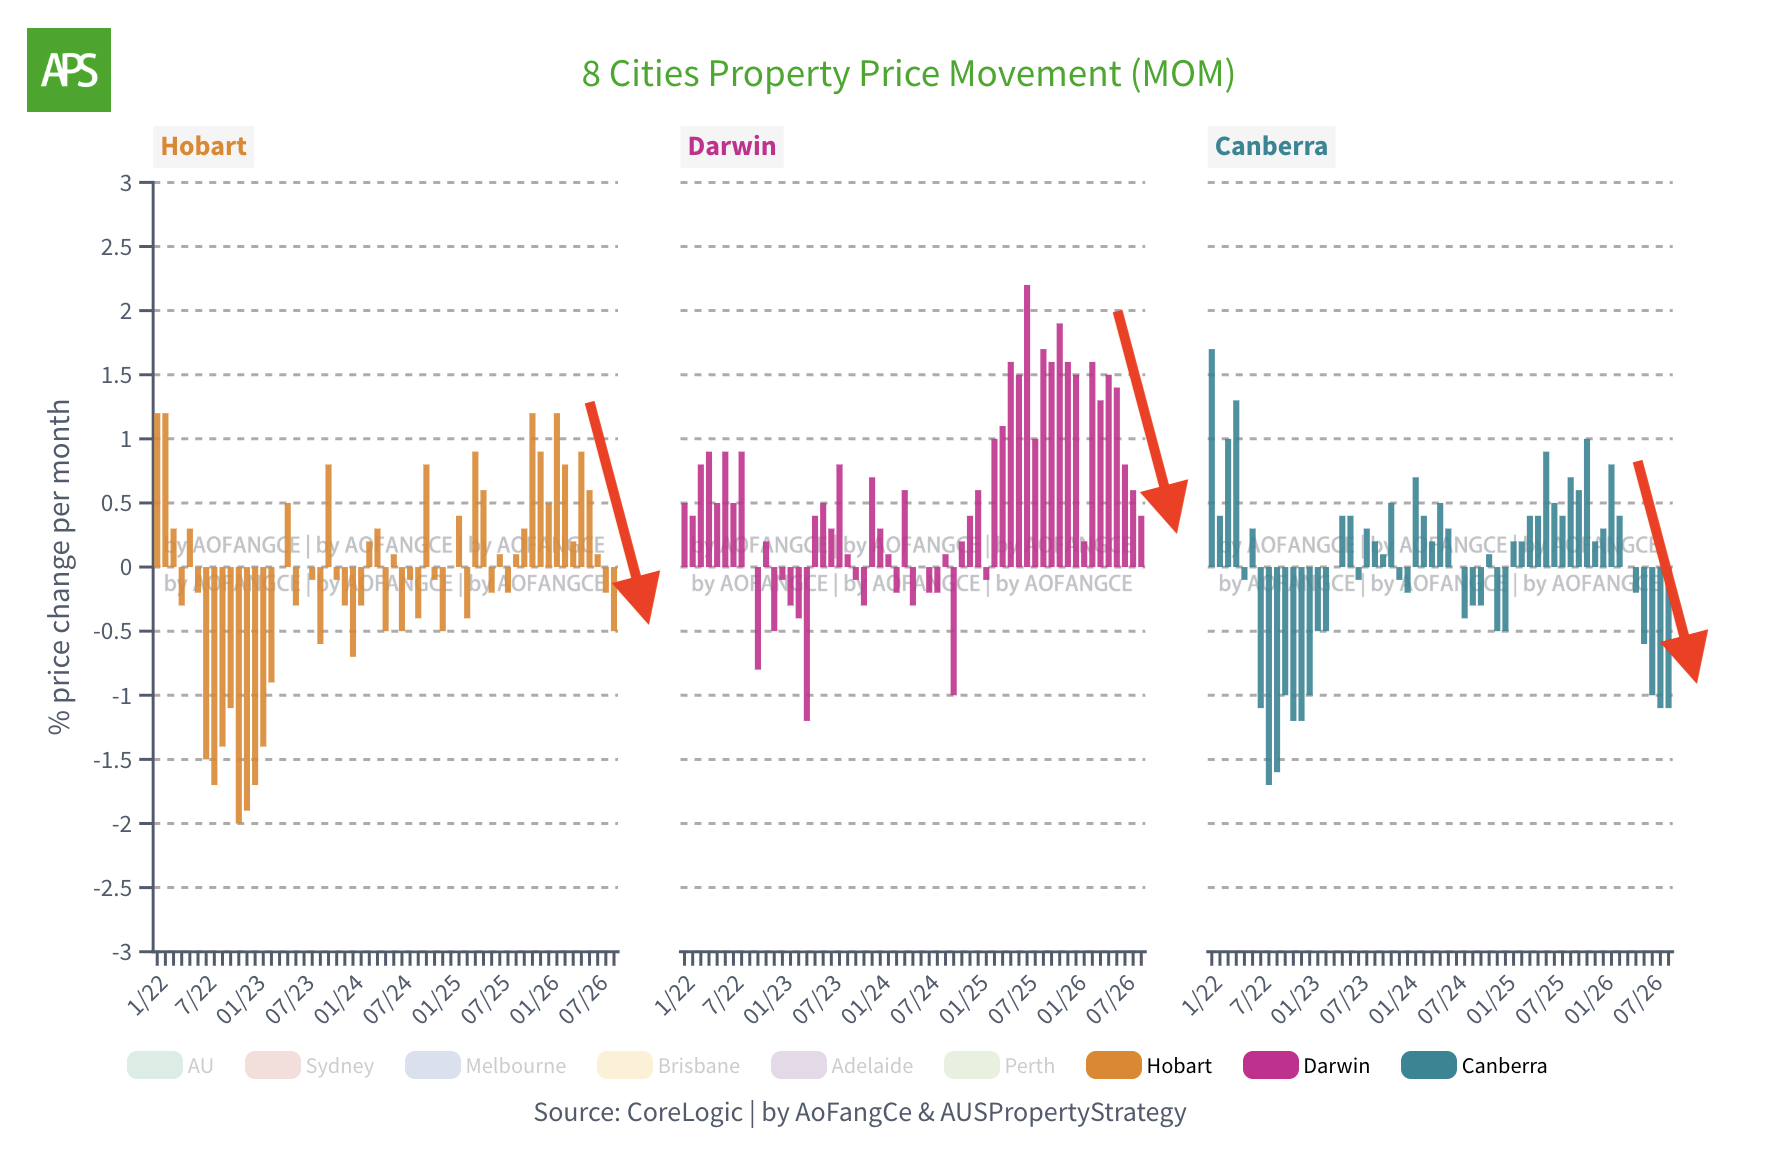
The biggest shift this month came from the mid-sized cities. Brisbane dropped 1.5%, overtaking Sydney as the fastest-falling capital in September. Adelaide and Perth both fell more than 1%. Perth still shows 10% annual growth, but that’s old gains from the past two years being handed back month by month. Canberra and Hobart are also falling, and Darwin’s 0.4% rise is effectively flat.
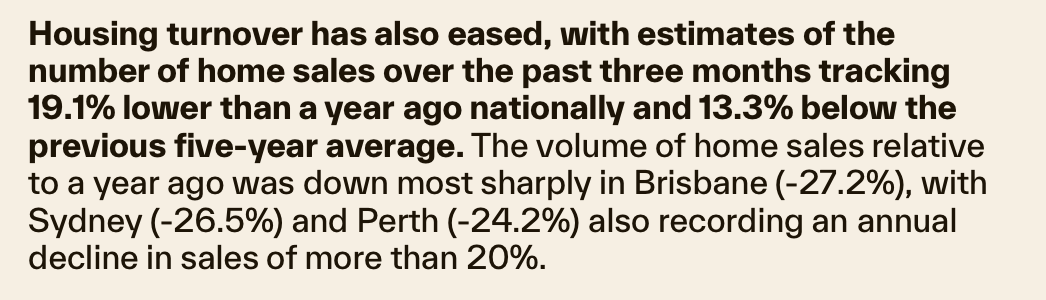
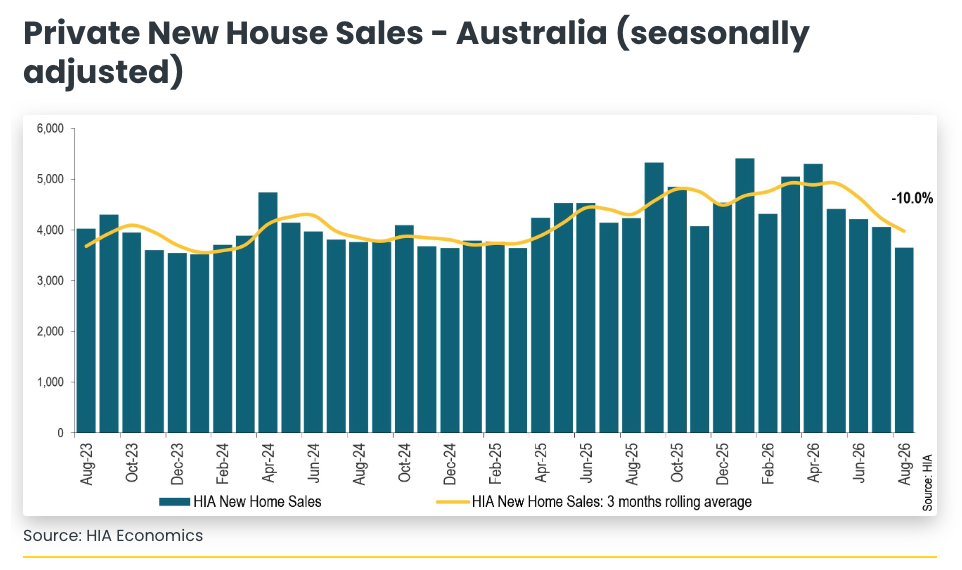
Over the past three months, resale volumes are down 19% nationally year-on-year. Brisbane and Sydney are both down by more than a quarter. HIA data shows new home sales across June to August were 7.7% lower, with August alone down 10%.
Now you might think prices are falling because everyone’s rushing to sell. It’s actually the opposite. New listings in September were 9% lower than last year, but total inventory is up 23%. Not much new stock is coming on, and the old stock isn’t moving. A typical listing now takes 39 days to sell, compared to 23 days a year ago. Sellers are stuck, watching their property sit there, and neither dropping the price nor pulling it off the market feels right.
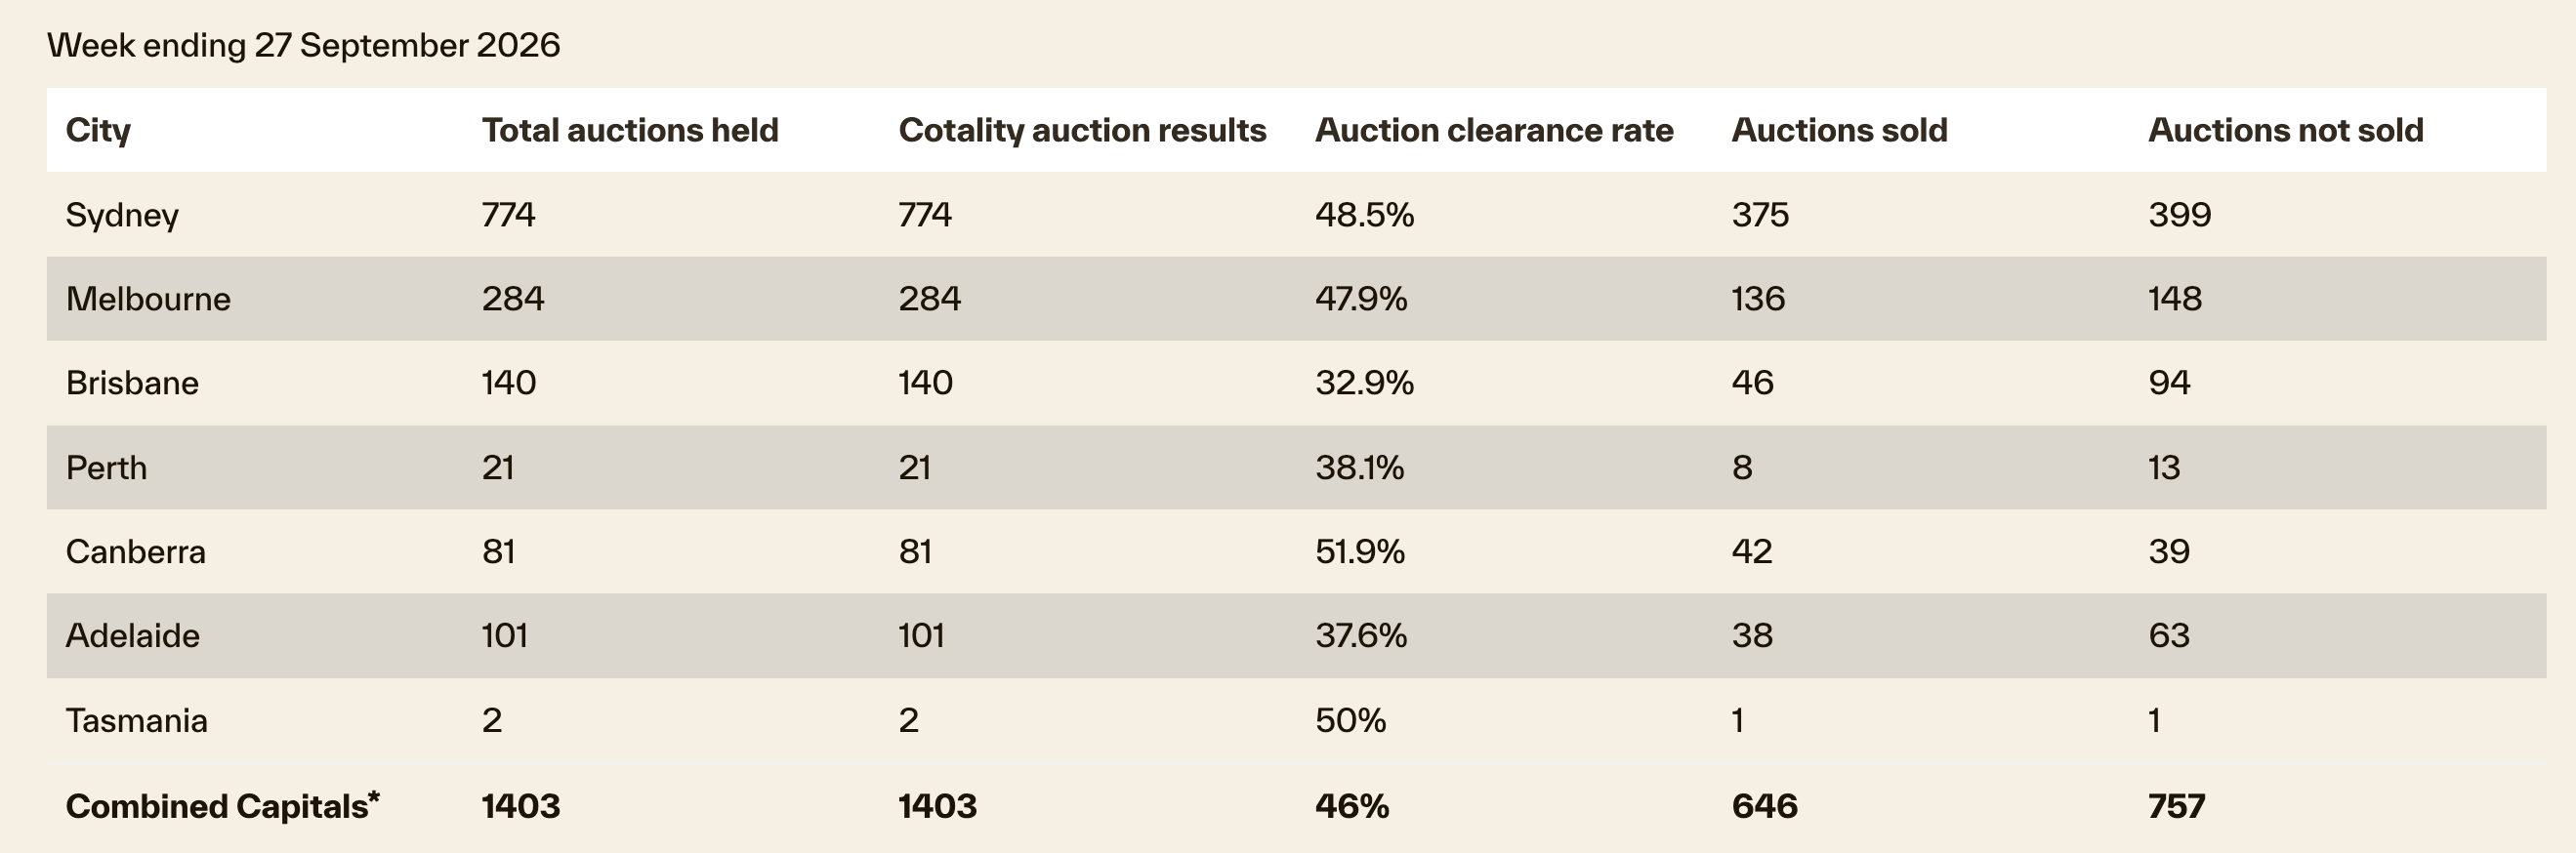
Auction clearance rates are sliding too. The preliminary rate briefly hit 58% in mid-September, then dropped to 54% and was revised down to 49%. On the last weekend before the hike, it barely topped 50%. Volumes are down nearly 20% year-on-year, and last year at this time the national clearance rate was around 70%.
One area holding up is rents. The vacancy rate rose to 2% in September, still well below the pre-pandemic 10-year average of 3.3%. Prices are falling but rents are still climbing, and the gross rental yield has hit its highest level since 2019. So with this many indicators all pointing the same direction, what’s behind it? The answer sits in the economy itself.
Economic headwinds intensify
What does the latest data tell us about where rates and prices go next?
On September 30th, the August CPI came in at 4% year-on-year, up from 3.5% in July. Half a percentage point in a single month. The RBA’s preferred measure, the trimmed mean, came in at 3.6% and has been stuck there for three months. That’s the core inflation rate, the one that strips out the biggest movers in either direction and shows you what’s really going on underneath.
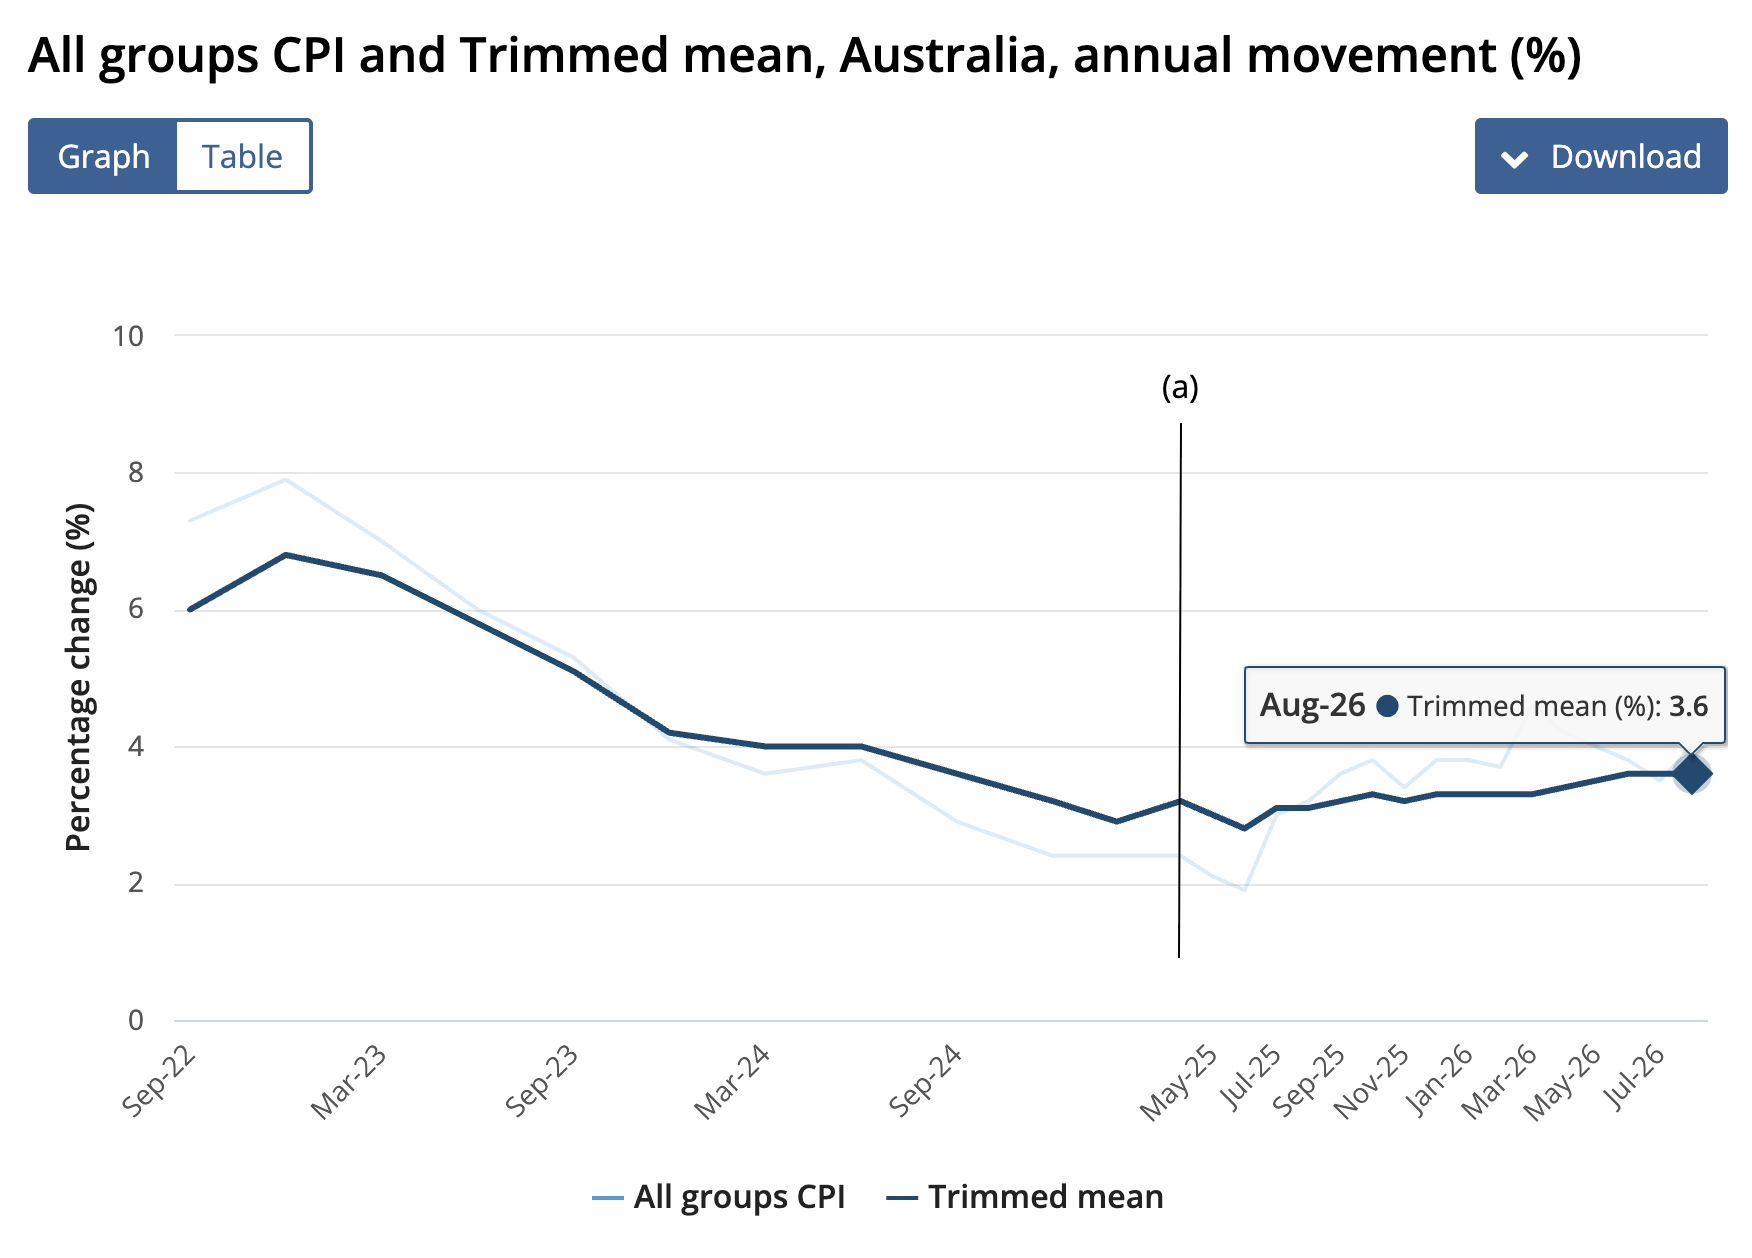
The headline jump was mostly fuel. Petrol surged nearly 15% in August after already rising 7.5% in July. The fuel excise reduction expired on August 3rd, and international oil prices were climbing at the same time. Rents remain the single biggest contributor to inflation at nearly 6% year-on-year, and new home prices are up over 5% as construction costs keep feeding through.
Now here’s a small piece of good news. The trimmed mean rose just 0.2% month-on-month in August, versus expectations of 0.3% and July’s 0.5%. It doesn’t sound like much, but it shows core pressure is starting to ease. When the data came out, bets on a November hike dropped on the same day.
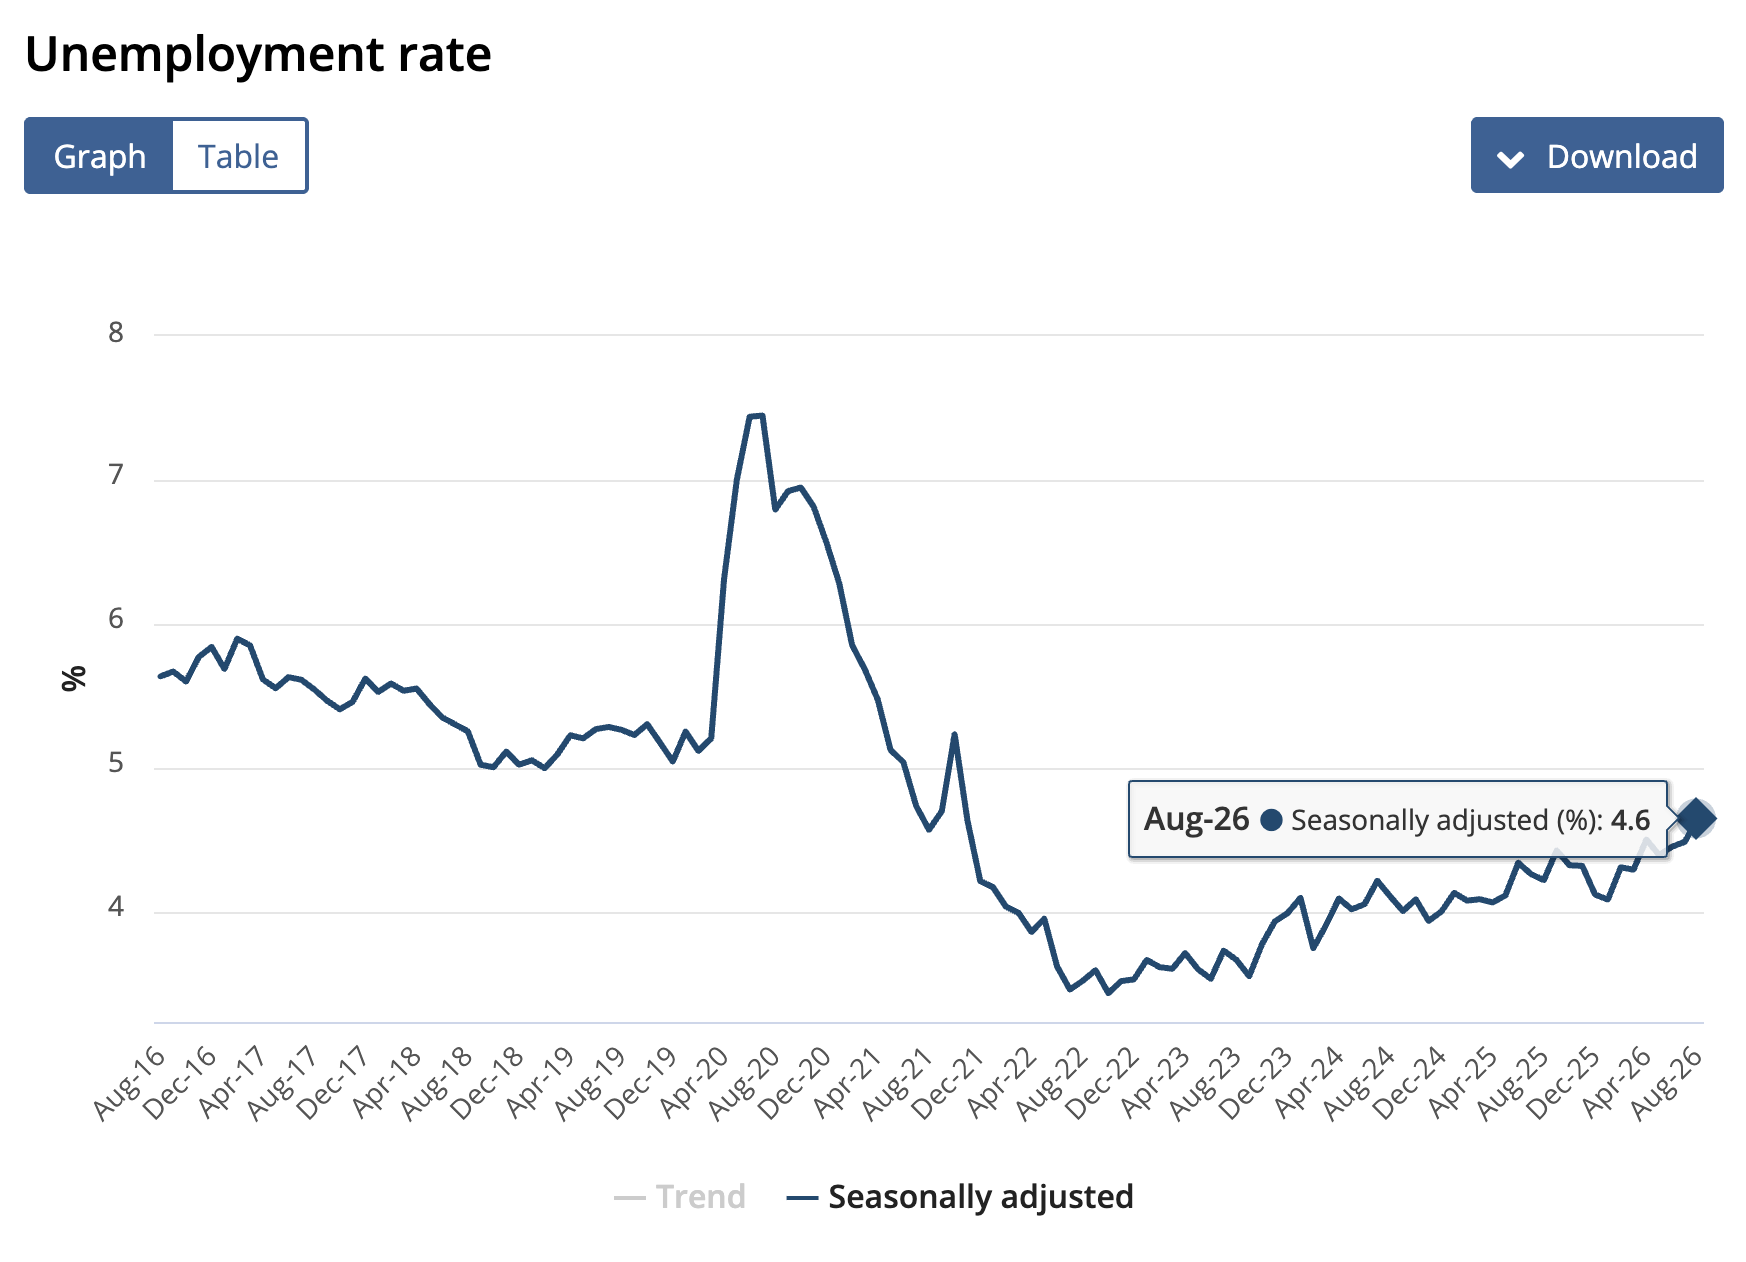
Unemployment rose to 4.6% in August, the highest since late 2021. Total employment still grew by nearly 40,000, but the workforce grew even faster. Full-time positions fell by over 6,000 while part-time roles grew by more than 40,000. The Westpac-Melbourne Institute consumer sentiment index fell 5% in September, sliding back into deeply pessimistic territory. Inflation at 4%, core inflation stuck, unemployment creeping up. You’d think the RBA might hold off, but they went ahead anyway.
I’m not saying we’re heading for a crash. But I am saying the risks are higher than they’ve been in years, and pretending otherwise doesn’t help anyone.
Before we keep going — if anything in today's video has you thinking about your own situation, there are two ways to get real answers. A free 15-minute call with one of our property investment strategists — bring your questions, get a straight answer, no strings. Or if you want the full done-for-you path — strategy, lending, property selection, portfolio, tax structure, wealth planning, all of it — book a free 30-minute Discovery Session and see how VISION Gold Membership actually works. Both links are in the description. Alright, let's get back to it.
The September 29 rate hike
What did the RBA actually say, and how did the banks respond?
On September 29th, the RBA raised the cash rate by 25 basis points to 4.6%. All nine board members voted in favour. This is the fourth hike this year. From last year’s low of 3.6%, rates are up a full 100 basis points. Last year’s three cuts have been completely reversed, and rates now sit above the 2024 peak.
The statement said the upside inflation risks flagged in August are materialising. The Middle East conflict has expanded, energy prices are higher than assumed, and AI-driven demand is pushing up prices globally. The RBA found companies already raising prices or planning to. The statement also said, “policy is mildly restrictive.” In plain English, the RBA no longer thinks rates are tight enough.
At the press conference, the Governor said only two options were considered: hold, or hike by 0.25%. She cited property market risk among the reasons for holding. On the Middle East, she said the conflict has made all of us poorer, and fuel, fertiliser, and transport costs look permanently higher. The longer it drags on, the more businesses pass those costs through. But she stressed the hike isn’t just about the war. Australia’s economy has excess demand on its own.
She didn’t give forward guidance. She hopes four hikes are enough but can’t be sure. She also said recession isn’t the base case. The written statement was hawkish, the press conference left room, and that’s where the banks split.
ANZ and Westpac expect another hike on November 3rd to 4.85%. CBA and NAB expect rates to hold at 4.6%. CBA said that September was most likely the last hike, but the November meeting depends entirely on the quarterly inflation data due in late October.
Now let’s talk about what this means for your repayments. From October 9th, all four banks passed on the full increase. On a million-dollar loan over 30 years, going from 5.5% to 6.5% adds roughly $640 per month. If November brings another hike to 6.75%, that’s about $800 more per month than the low point. Cotality estimates this year’s four hikes have cut borrowing capacity by close to $90,000. Same income, lower tier of property. But while the four hikes look scattered, the logic behind them is clear.
The pattern behind four rate hikes
What’s driving each decision, and is there a pattern?
The first hike on February 3rd came before the Iran conflict even started. The war began on February 28th. The RBA's reasoning was that the economy was running harder than expected, with supply unable to keep up with demand, and private spending was growing faster than forecast. Nothing to do with the war.
The second on March 17th passed 5-4. The statement cited domestic capacity pressures and warned that surging oil prices from the conflict could push inflation higher. But the Governor emphasised that domestic demand was the main problem.
The third on May 5th passed 8-1. March quarterly inflation had hit the year’s high, with petrol surging 33% in a single month. Then freight, groceries, services, and wages followed. That’s the second-round effect, and it’s the kind of inflation that’s hardest to bring under control.
So why did they pause in June and August? A two-week ceasefire came in early April. In mid-June, the US and Iran signed a memorandum of understanding. Oil prices fell back to pre-war levels and core inflation stabilised.
September was different again. The memorandum fell apart in early July, oil climbed back above $100 within three weeks, and the conflict escalated. The RBA’s statement was clear: higher oil prices have already partly passed through, on top of existing capacity constraints.
Every hike has the same foundation: domestic demand running too hot, with oil price spikes acting as the trigger. When oil spikes and core inflation won’t come down, the RBA hikes. When oil pulls back and core inflation steadies, they pause. The voting margins tell the story too. From 5-4, to 8-1, to 9 - 0.
So here’s the takeaway. Australia’s interest rates are now more tied to oil prices than to domestic demand alone. Oil has become a leading indicator for Australian inflation, interest rates, and ultimately property prices.
Oil prices and government stimulus
Trump said in late September that oil flowing through the Strait of Hormuz hit a record. But as of October 2nd, prices were still around $100, compared to just over $72 the day before the conflict started. That "record" was backed-up tankers released over one or two nights, and the sustained daily flow hasn't returned to pre-war levels. What's really keeping prices elevated is the supply side: global inventories have been drawn down by over 500 million barrels since February, diesel is even tighter than crude, and US-Iran negotiations have stalled while tankers are still being attacked in the strait. All of that feeds into a risk premium that pushes up shipping insurance, then freight costs, then the price of oil itself.
And it feeds straight through to Australia. Sydney diesel hit 2.85 per litre on September 28th, more than a dollar above where it was in late June. Diesel pushes up freight, freight pushes up grocery and service prices. That's the second-round effect, and it pushes rate cuts even further away.
The rate hike and rate cut timeline
What's it going to take for rate cuts to arrive, and how long are we looking at?
The Governor has said that to get inflation back to 2.5%, the trimmed mean needs to stay at or below 0.6% per quarter. Both the March and June quarters came in at 0.8%.
On October 28th, the ABS releases September quarter inflation, the single most important number before the November meeting. ANZ expects it around 1%, which is why they're betting on a November hike. CBA ran the RBA's own forecast through their model and got 0.84%. If it hits 1%, a November hike becomes the base case. Between 0.8% and 0.9%, they'll most likely hold. The November meeting also brings a new Statement on Monetary Policy, and the updated inflation forecast will almost certainly be revised higher, which on its own raises the odds of another hike.
ASX rate futures price a November hike at about 27%. But if you look out to March next year, the odds of at least one more hike sit at 75%. November might not bring the next hike, but this hiking cycle probably isn't over. That said, the Governor has pointed out that rate hikes take 12 to 18 months to flow through. In my view, a pause in November is slightly more likely, but if core inflation comes in at 1%, that changes.
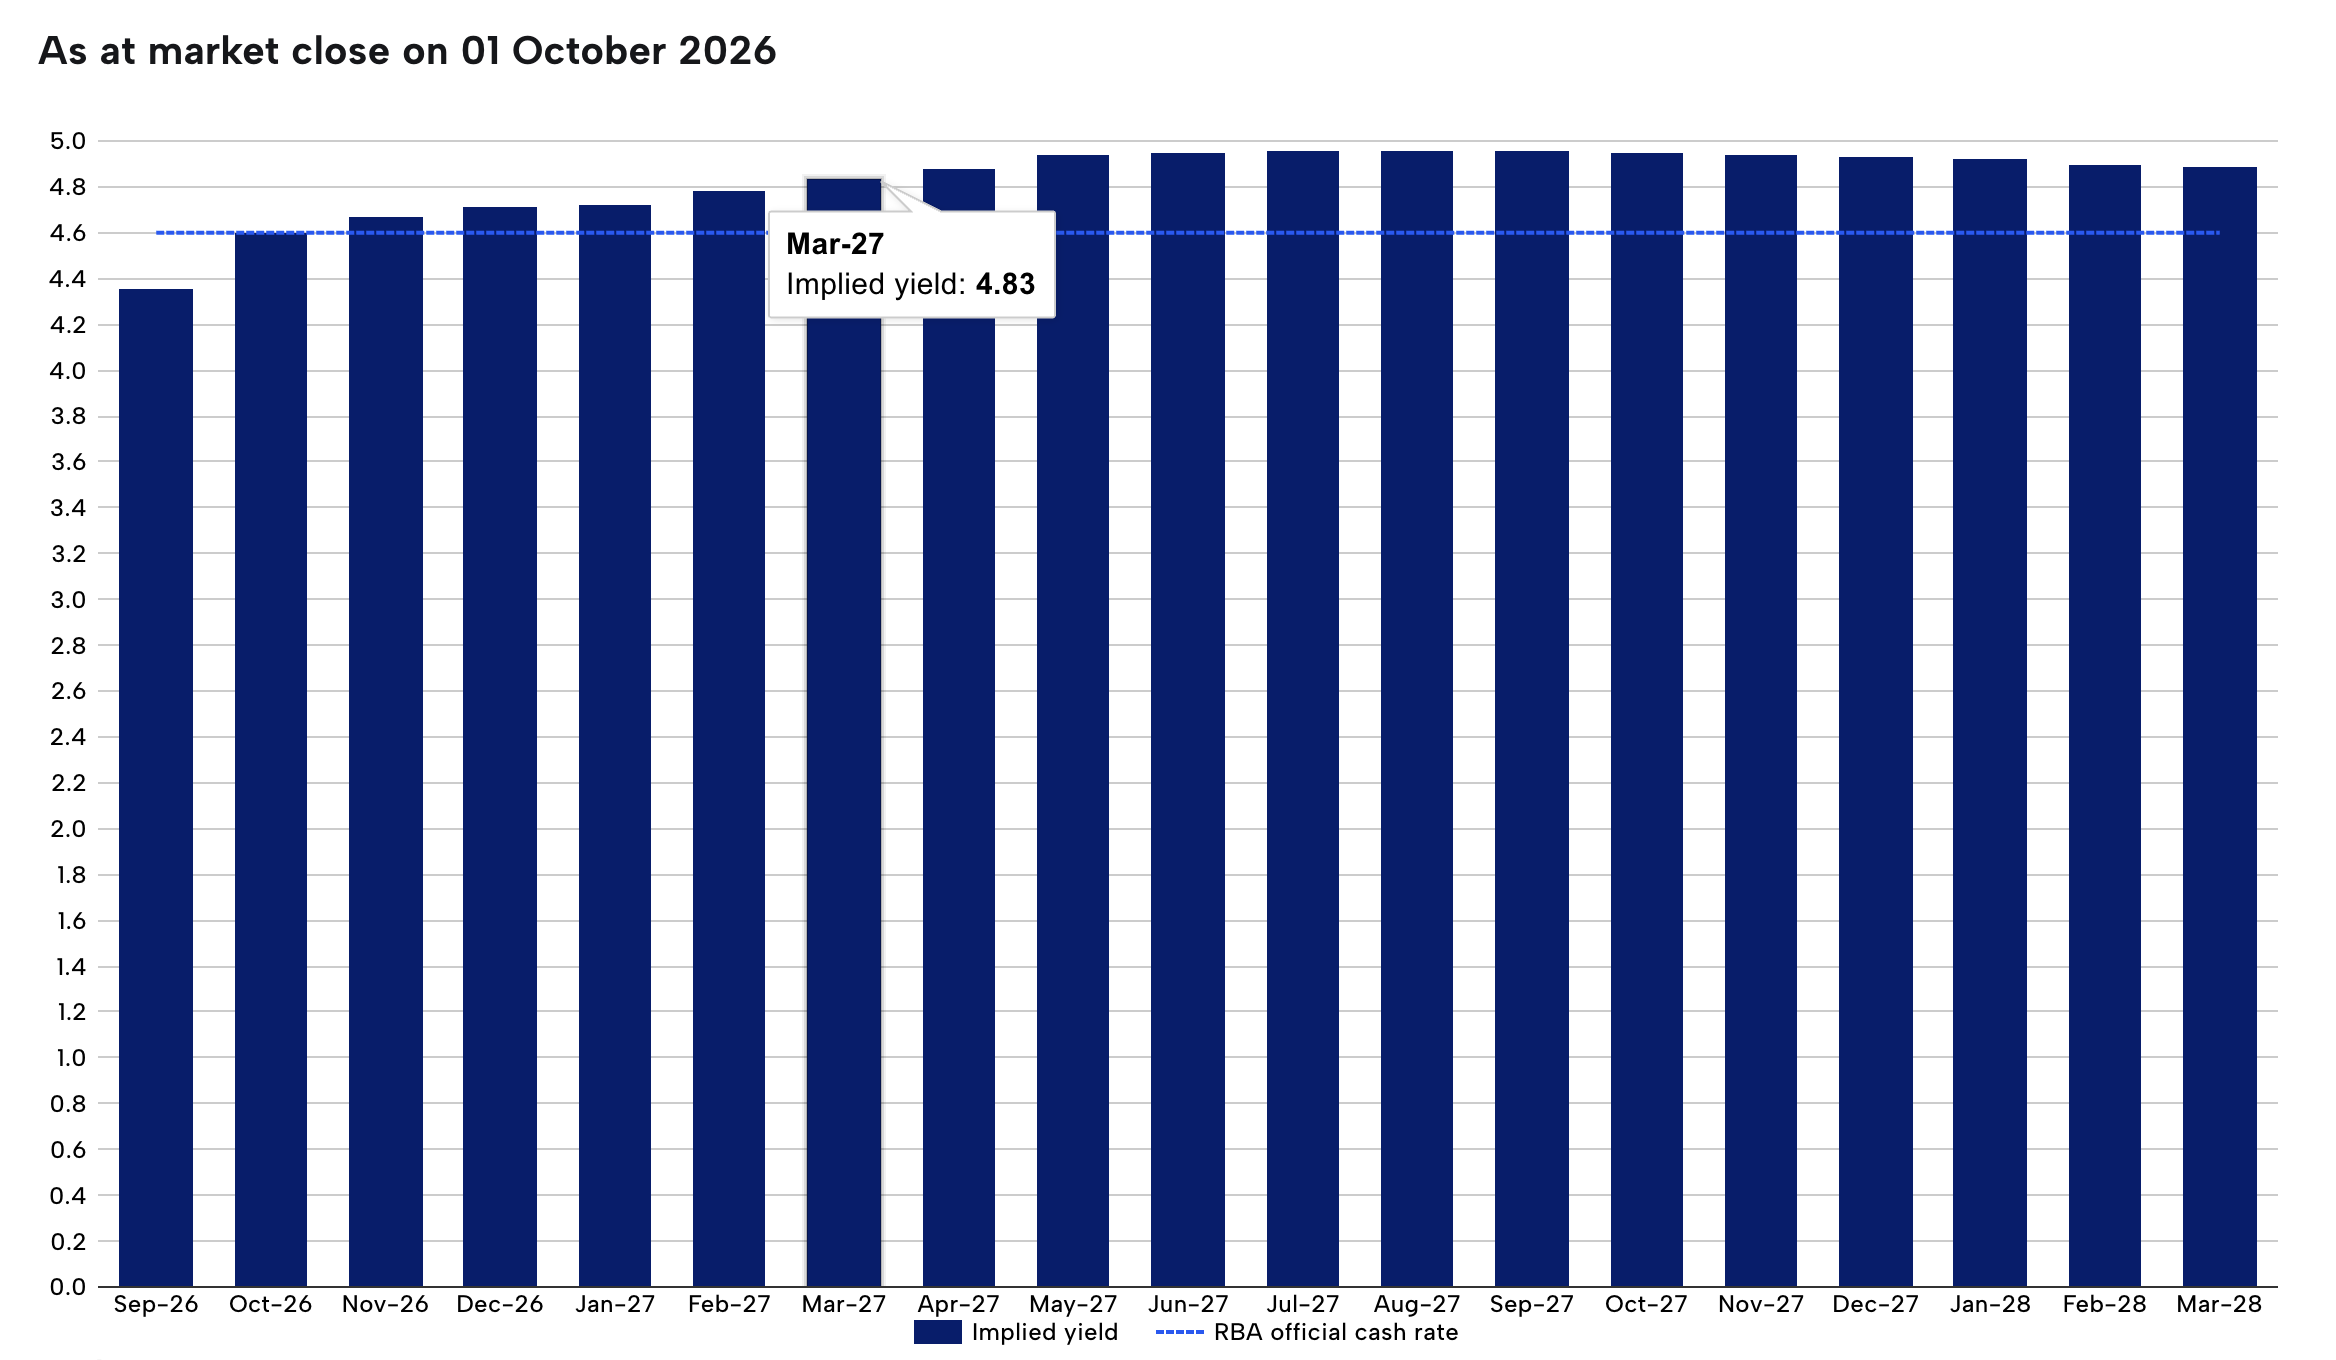
When do cuts actually arrive? CBA has the earliest call, one cut each in August and November next year. Westpac and AMP are looking at the second half of next year. ANZ doesn't see a cut until November next year.
But the real variable is the war. If a ceasefire comes in Q4 this year, cuts could start as early as August next year. If the conflict drags into Q1, cuts shift to November. If the fighting runs past mid-next year, cuts get pushed to 2028. The RBA's August forecast has the trimmed mean not returning to 3% until mid-next year and not reaching 2.5% until early 2028.
Rates aren't coming down soon. So what should property owners and buyers actually do?
What everyday investors should do
Is the market heading for a crash, and what are the practical moves right now?
The RBA's financial stability assessment, published October 1st, gives us a read on how much stress the market is actually under. Less than 2% of variable-rate owner-occupiers had a cash flow shortfall as of early July. Negative equity affected less than 1%. Even with a further 20% price drop, only about 5% of loans would move into negative equity. As far as the RBA is concerned, the property market isn't where the real danger sits. They're more worried about overseas AI financing and global bond markets.
That said, the correction isn't finished. Cotality's head of research expects a 10% to 15% peak-to-trough decline, extending into next year. AMP's chief economist puts the worst case at 20% if the war drags on and oil hits $150. But these are forecasts, not facts. And here's what a lot of people miss: fewer new homes sold this year means fewer construction starts next year, and the supply gap keeps widening.
If you've got a mortgage, run the numbers. If holding costs are too high, see whether another lender offers a better rate. If the numbers work, switching could save you real money. If you're looking to buy but not confident on timing, there's nothing wrong with waiting for a clear turn or for cuts to begin. If you're experienced or a VISION Gold member, Q4 this year and Q1 next year could be your window, and we will guide you through the process.
New homes and existing homes need to be looked at separately. After the tax changes, new homes still qualify for negative gearing and the CGT discount has been preserved. For existing homes, you need to work out how the new rules affect your cash flow and net return first.
On a city level, focus on areas with larger supply gaps and lower vacancy rates. Get the location right and you'll see a smaller decline, a faster recovery, and less pain while you're holding. Being able to hold on matters more than buying at the perfect moment.
Watch the video version of the blog on YouTube.
15 Minutes Free Consultation (Limited-Time Free Offer)
If you have any questions about Australian real estate, we invite you to use our 15 Minutes Free Consultation service. Once you have filled in the form, a professional property investment strategist will be in touch with you. They will assess your needs and provide fundamental advice. This service is designed to help answer general property-related queries. BOOK NOW.
VISION Membership
Our Flagship Service: VISION Membership. Your One-Stop Property Investment Manager – Build a Tailored Portfolio and Achieve Financial Freedom
Whether you're an employee, a professional, a business owner or even a new migrant, everyone has a financial goal for the future. The VISION Membership is designed to solve all the pain points in your Australian property investment journey through one single, comprehensive service.
By analysing your current financial situation and long-term goals, we'll tailor a property investment plan just for you. Our team will match you with the ideal mortgage structure, tax strategies, wealth planning, and legal support, empowering you to go further, faster, and smarter on your path to financial freedom.
VISION Membership is perfect for busy individuals who want a professional team to create, expand and manage their Australian investment portfolio. If you're looking for a dedicated team, including real estate investment experts, mortgage brokers, accountants, financial planners, and property solicitors, VISION Membership is your ideal solution.
Start with an obligation-free 30-minute discovery session on Zoom. BOOK NOW.
VISION Buyer’s Agent
No time for inspections? Tired of dealing with pushy selling agents? Unsure how much to offer or feeling nervous about auctions? Worried about buying the wrong property? If any of these sound like you, AusPropertyStrategy's Australia-wide VISION Buyer's Agent Service is here to help.
We provide end-to-end support to help you build an optimised property portfolio and achieve your financial goals—whether you're investing interstate, refinancing, or planning post-settlement leasing or resale. Our services cover everything from suburb research and property selection, to price negotiation, auction bidding, and post-settlement support.
Start with an obligation-free 30-minute discovery session on Zoom. BOOK NOW.
real estate australia,real estate investing,australian property,australian housing market,australian economy,australian property investment,australian property market,buying property,australian real estate,mortgage brokers brisbane,first home buyer,Australian Real Estate,Australian Real Estate Investment,Australian Property Investment,Real Estate Investment,Property Investment,Property Investment Australia,Passive Income,Positive Cash Flow,Australia Real Estate Investing,Australian Real Estate Investors,Australian Property Investors,Vision Wealth Mentors,Vision Real Estate Investors Australia,financial freedom, freedom through property investment,real estate investors,property investment,passive income,positive cash flow,real estate course,real estate courses,real estate training,australian property market,property investment brisbane,property investment sydney,melbourne property market,investing in brisbane,investing in melbourne,how to invest in property,buying properties,start investing in property,property investment strategy,how to buy investment property,property investing tips,best suburbs to invest in sydney,locations real estate,prime location,property growth by suburb,capital growth suburbs


