

75 Years, 9 Downturns: The Pattern Every Australian Investor Must Know. APS170
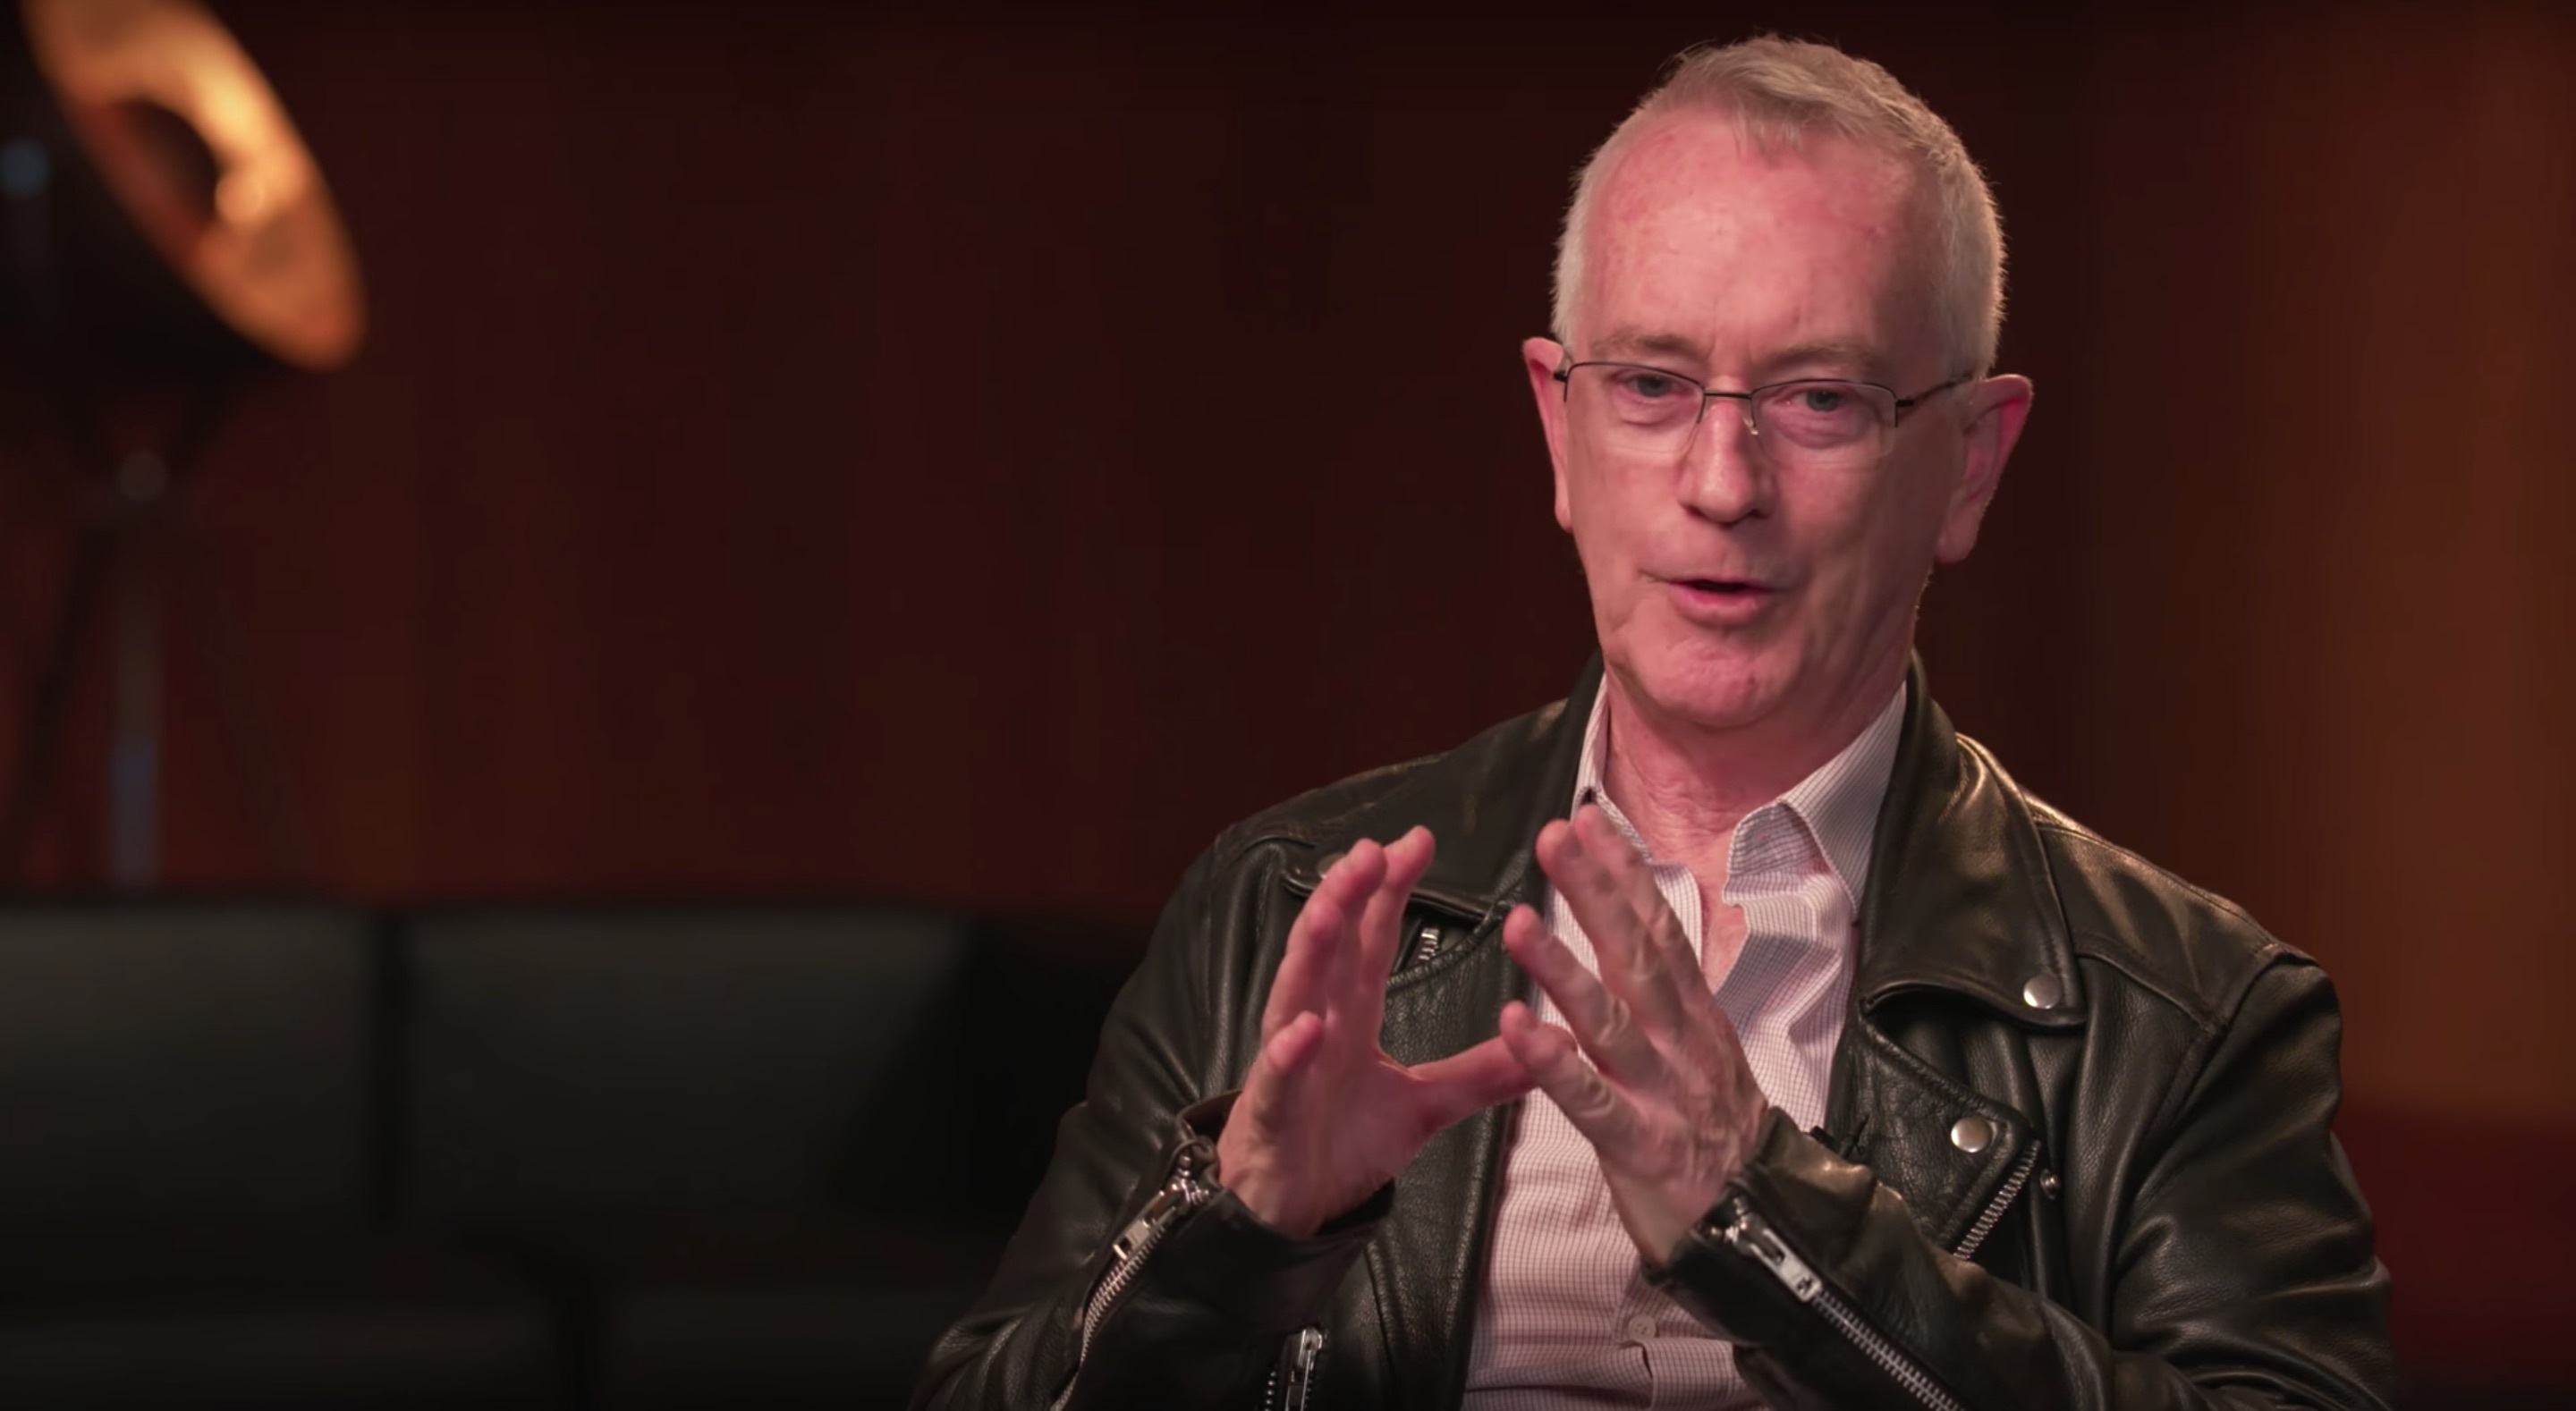
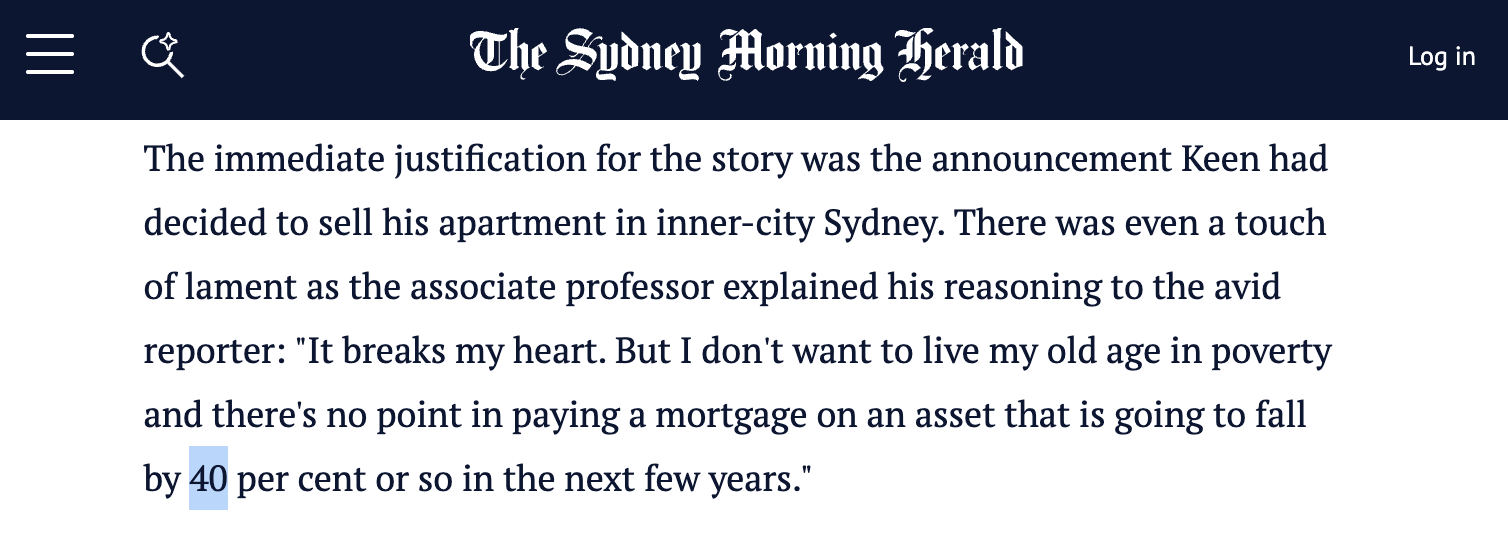
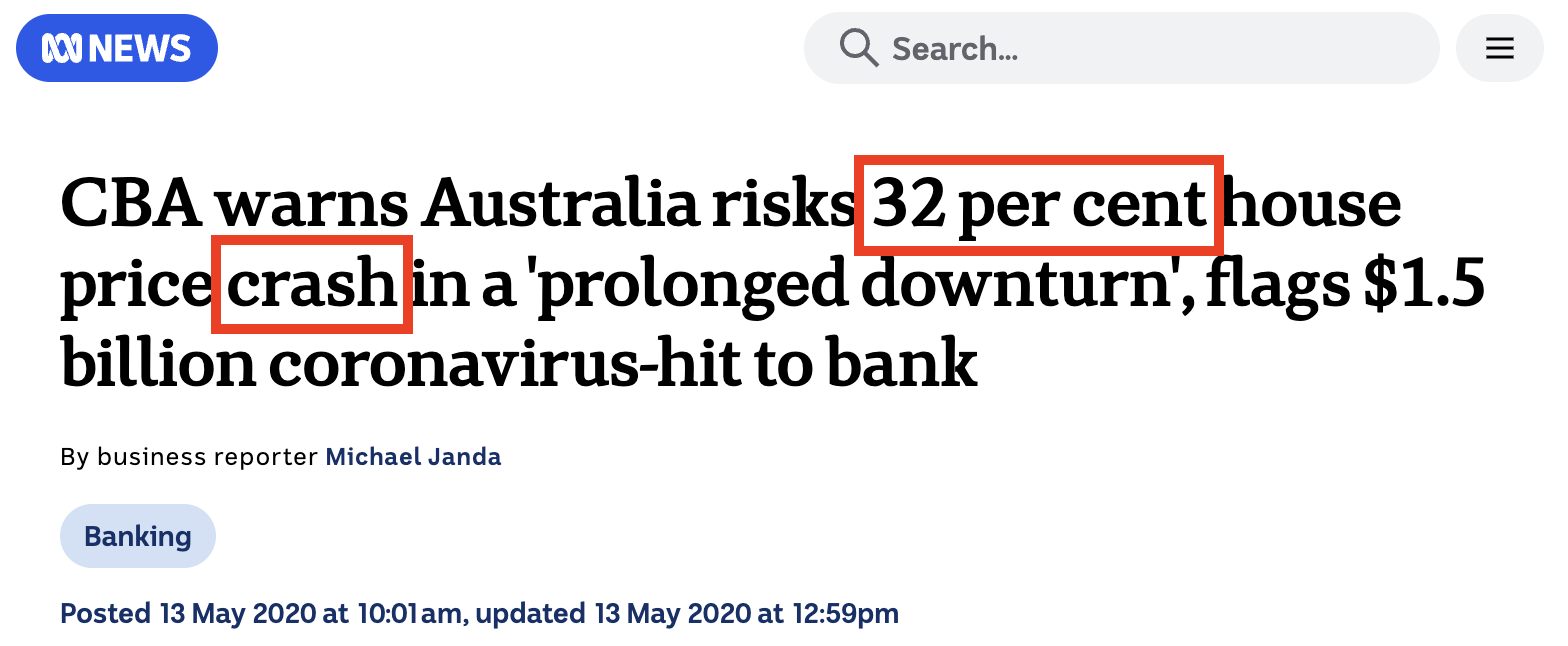
A drop of 15% or more. That kind of crash prediction has come up countless times over the past 20 years. Steve Keen said 40%. Harry Dent said 50%. CBA said 32% in a worst case. How many came true? Zero. Not one. A lot of people right now are being overwhelmed by negative headlines about the Australian property market, and some are thinking about walking away from property investment altogether. But if you step back and look at history, the market tells a very different story.
In today’s video, I’m using 75 years of data to walk you through all 9 downturns, how long they lasted, and what triggered each rebound. After that, you might look at the forecasts floating around right now and just laugh.


Banks Keep Changing Their Minds
CBA, the biggest bank in Australia. In March, they said 2026 prices would rise 5%. After the May budget, they revised that down to 3%. By June, they said flat. Then on September 1st, their latest report came out calling for a 9% national peak-to-trough decline, with the five major capitals down 10%. Their own economists admitted the past three months were “bigger and faster than we expected.” Six months, from up 5% to down 9%. That’s a 14-point swing. That’s not forecasting, that’s chasing the market.
And it’s not just CBA. ANZ says capital cities will drop 10.6%, with Sydney down 14.5%, calling it “the most severe since 1983.” HSBC is the most bearish at 13% nationally. AMP says 10%, and adds that the downturn has “only completed about 35%.”
The consensus on peak-to-trough decline sits between 8% and 11%, with the bottom expected around the first half of 2027. One independent economist has called this “the biggest downturn in roughly 50 years.”
So where do they disagree? Not on property, on interest rates. CBA and ANZ are betting the RBA hikes once more to 4.60%. HSBC is betting 4.85%. Westpac is the outlier, refusing to predict a hike and calling this “a brief pullback, not a crash.”
The market is falling, though. Cotality data from September 1st shows national values down 3.6% from the March peak. Sydney values are down 7.1% from February, five straight months of decline, and 93% of capital city suburbs recorded falls over winter. Volumes have dried up, and auction clearance rates have been sitting below 50% since late May. Cotality says Sydney is dropping faster this time than at the same point in the 2022 downturn.
The numbers look bad. But before you start panicking, let me take you through these banks’ prediction track records over the past 20 years. You might feel quite differently after that.
20 Years of Prediction Track Records
Over the past 20 years, every single prediction of a national decline of 15% or more has failed. Steve Keen bet on a 40% crash, lost, and walked 224 kilometres from Canberra to Mount Kosciuszko. Harry Dent started calling for 50% in 2014, kept it up until 2024, ten years, wrong every time. NAB called for 20% in 2022, and the actual drop bottomed out under 10%.
Then there's 2020. At the height of the global panic, CBA came out with a worst-case call: minus 32% nationally. Headlines everywhere said property was going to collapse. What happened? Prices rose 3% for the full year, then shot up 22.1% in 2021. That’s a 35-point gap between the forecast and what actually happened. If you’d listened to CBA and sold, you didn’t dodge a crash. You sold on the eve of the biggest price surge in history.
Now look at turning points. In 2022, the year rates turned, API Magazine surveyed 26 economists and only 3 picked the decline. A 12.5% hit rate. This year, Reuters surveyed 33 economists and 29 got the interest rate direction wrong, an 88% error rate. As of November 2025, not one institution had published a forecast for 2026 prices to fall. The same banks now calling for drops of 9% to 13% were saying prices would go up just six months ago.
The pattern is simple. Bank forecasts are backwards-looking. They call for falls after the market is already falling and revise upward once it’s already rising. When the trend carries on, they get it right 90% to 100% of the time. But at turning points, when a forecast would actually help you make a decision, the hit rate drops to somewhere between 0% and 12.5%. So when CBA says down 9% and ANZ says down 10.6%, you have to ask yourself whether that’s really something you should be banking on.
But that’s not even the most revealing part. The 75-year data goes further.
75 Years of Cycles, Pulled Apart
Since 1950, there have been 9 national downturns. I’ll run through the first four quickly, then slow down.
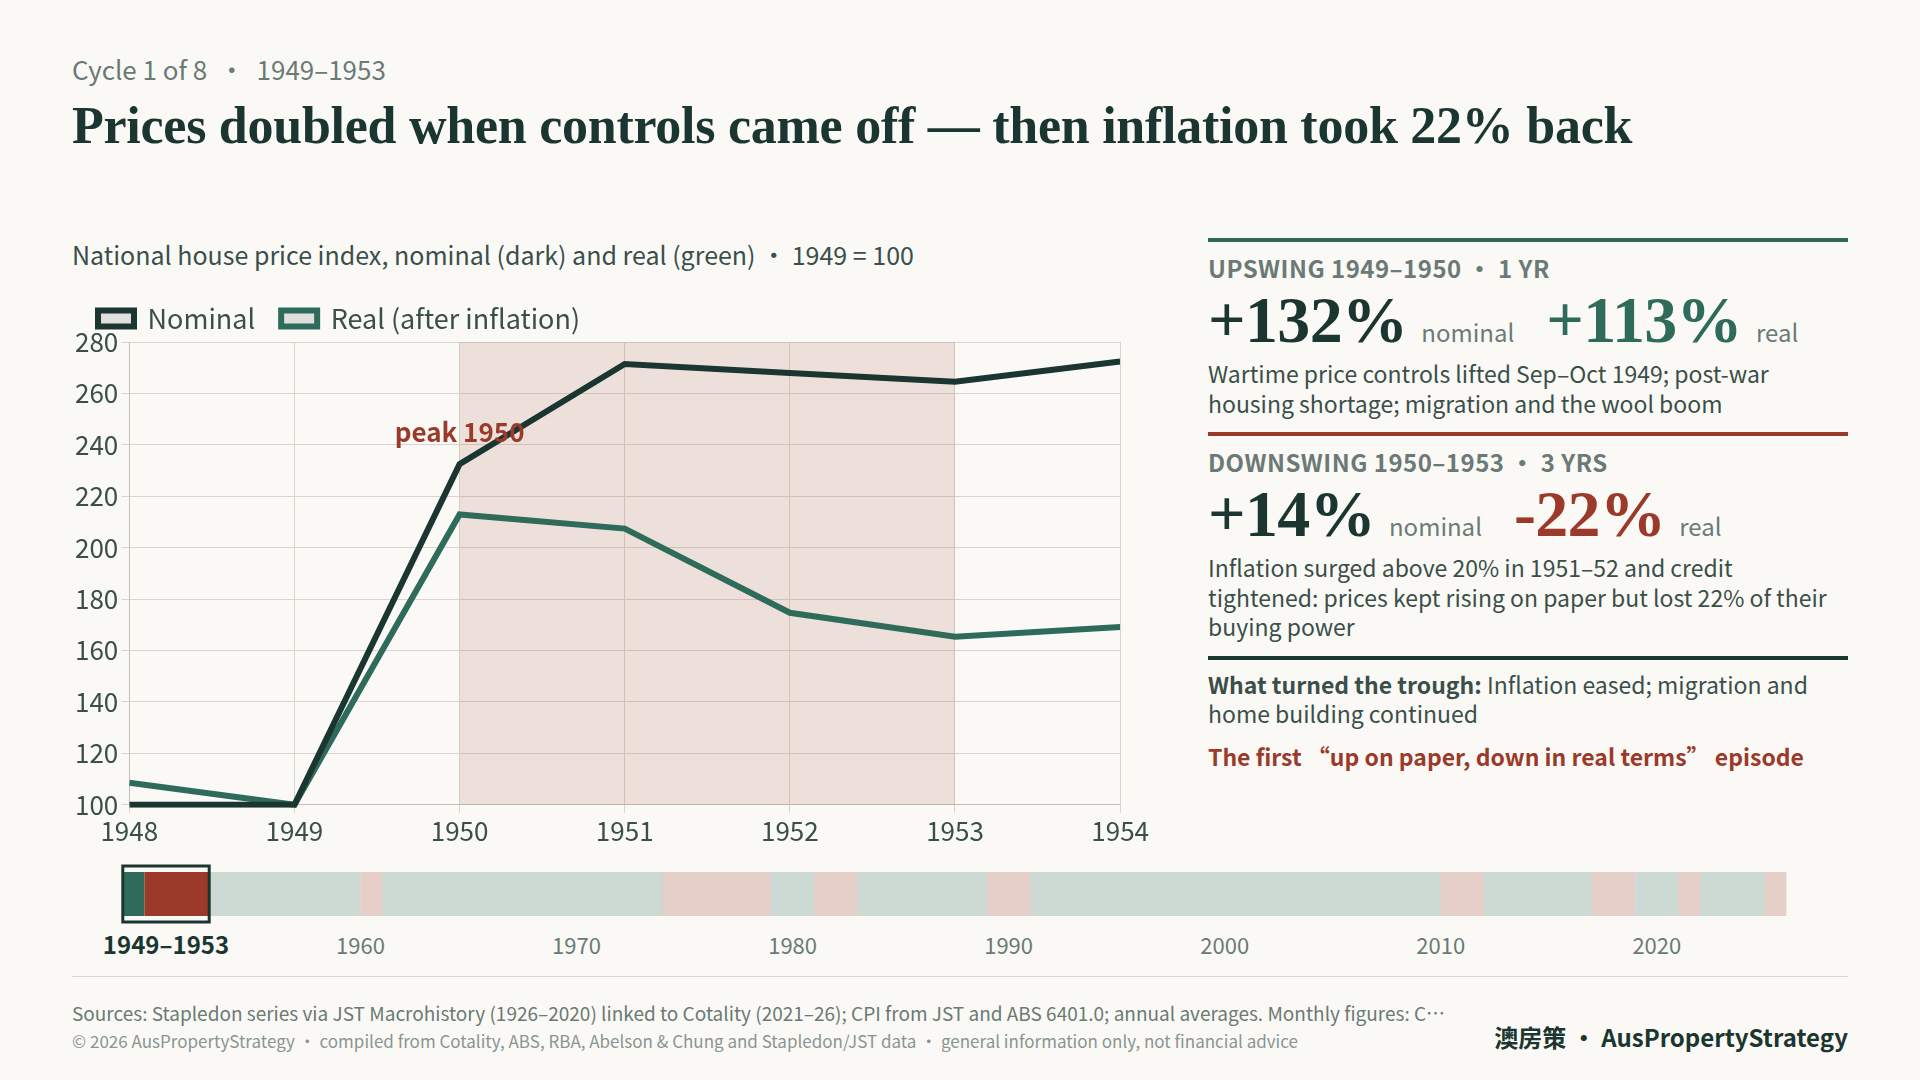
Cycle one, 1949 to 1953. Post-war housing shortage, price controls lifted, prices more than doubled. Then inflation took off from 1951 and the cost of living outpaced property. Prices still looked like they were going up, but purchasing power shrank 22%. The first time property “looked like it went up but actually went down.”
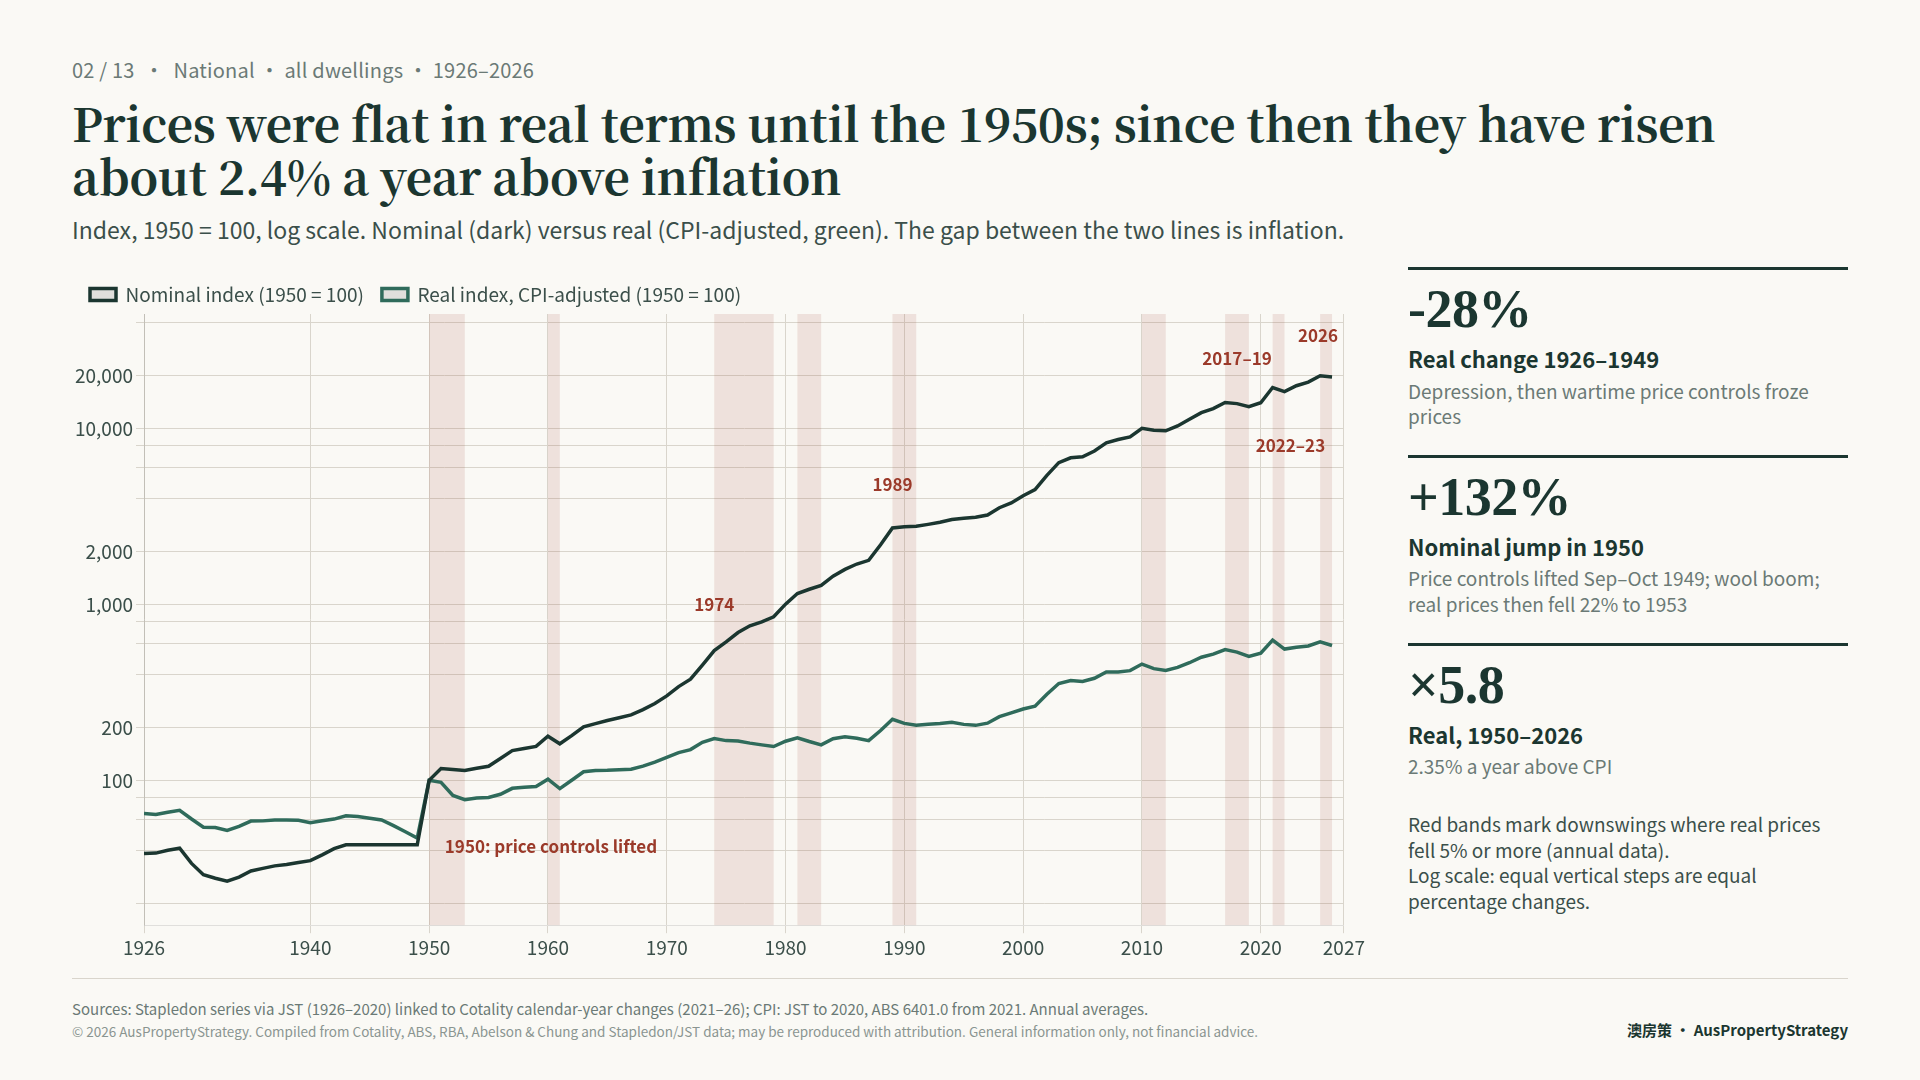
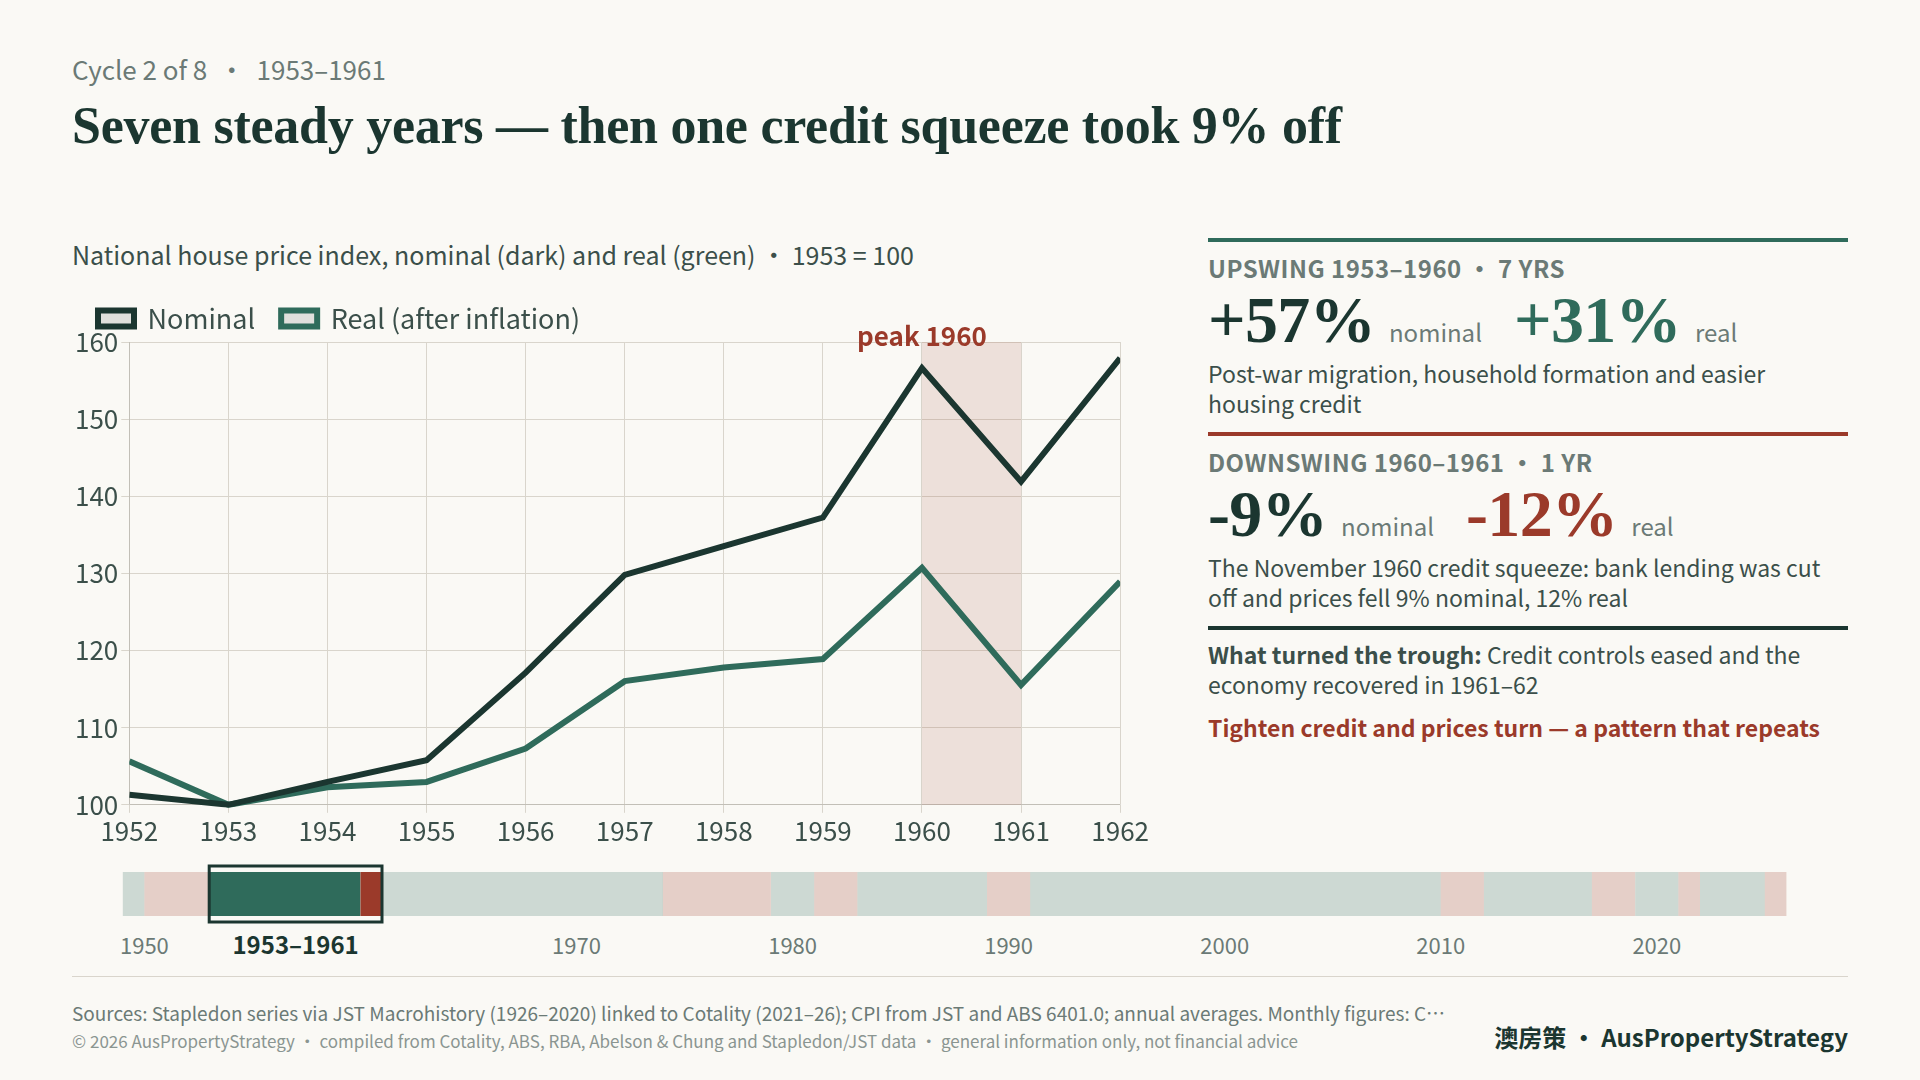
Cycle two, 1953 to 1961. Immigration and housing credit pushed prices higher for 7 years. Then in November 1960 the government slammed down a credit squeeze, cutting off bank lending. Prices fell 9%. Credit tightened, prices turned.
Cycle three, 1961 to 1979. A 13-year bull run until the 1973 oil crisis pushed inflation past 15% and the government tightened credit. Prices rose 56% in dollar terms, but purchasing power fell 10%. Perth lost 28%, Hobart lost 31%. This downturn dragged on for 5 years, the longest on record. The second time the property “looked like it went up but actually went down.”
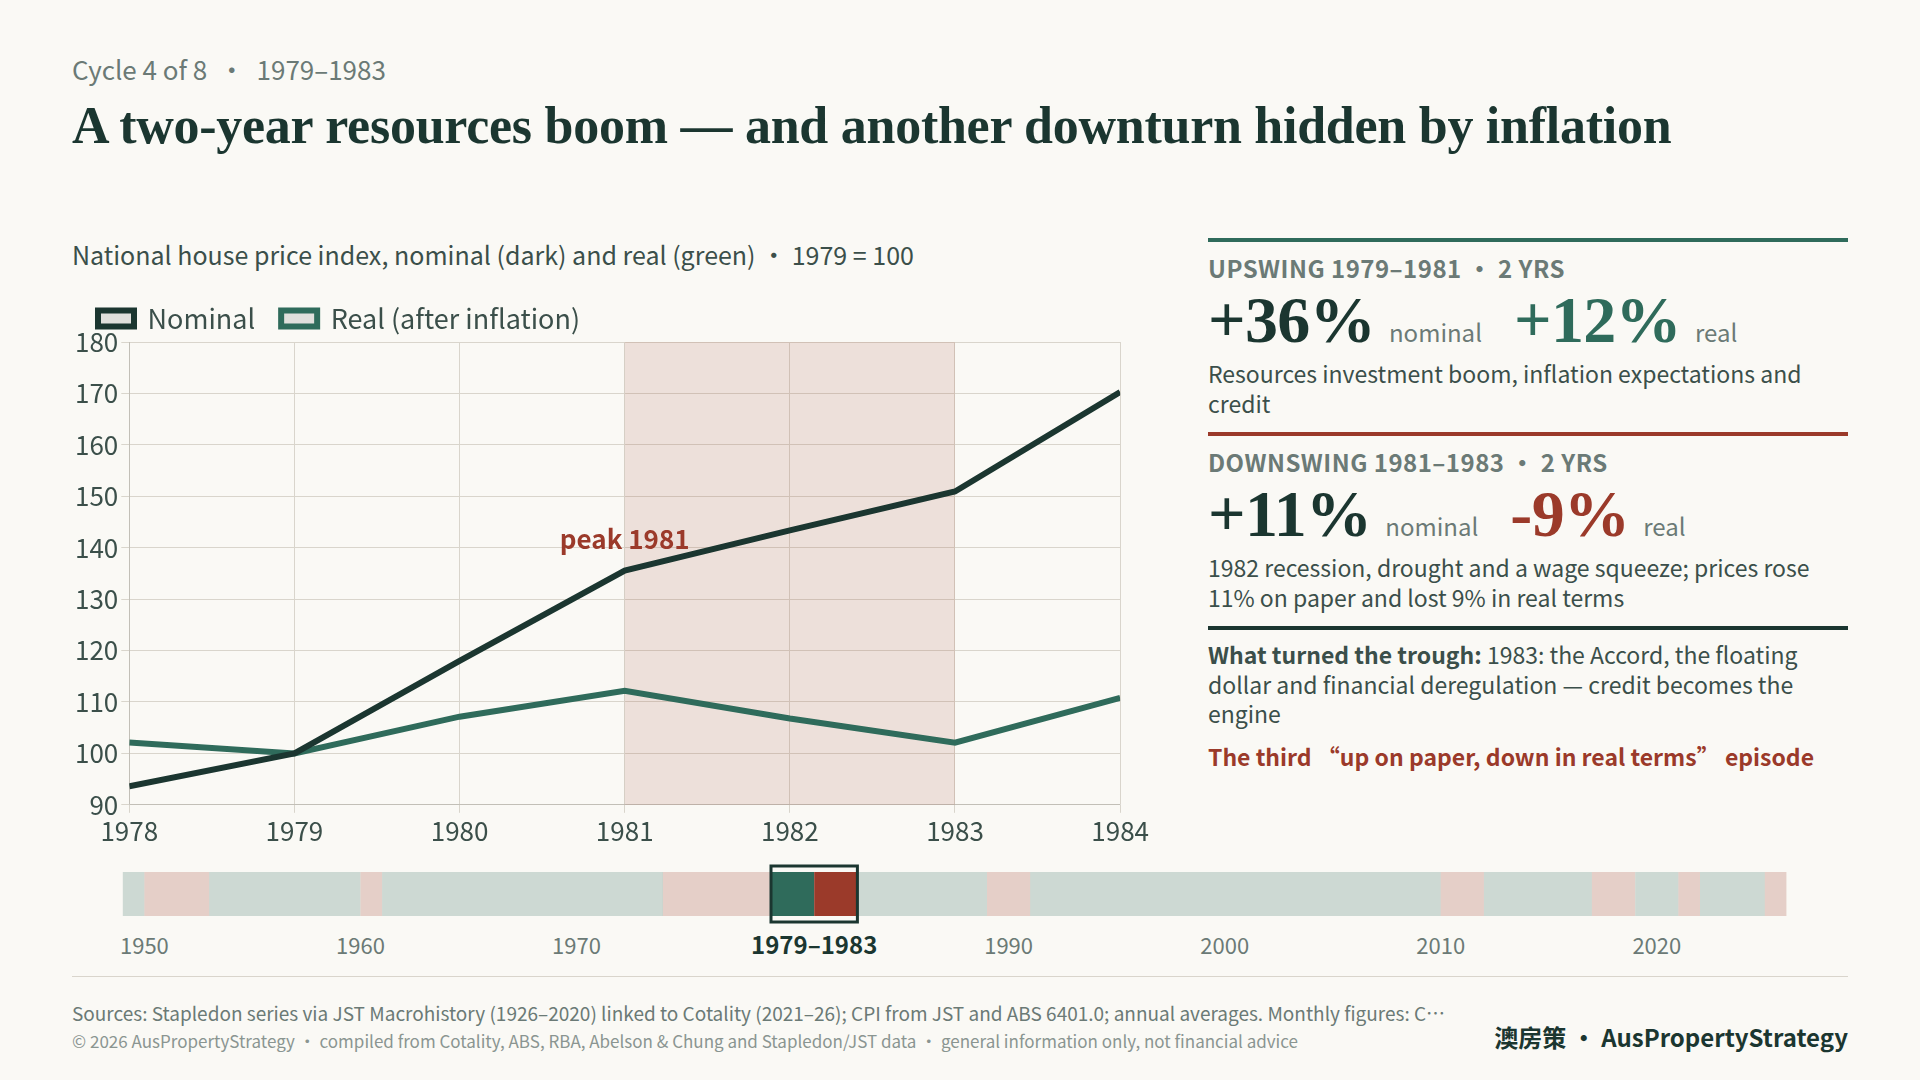
Cycle four, 1979 to 1983. A resource-boom bull run, prices up 36% in 2 years. Then the 1982 recession hit alongside drought and wage restraints. Prices rose 11% on paper, but purchasing power shrank 9%. Same story for the third time. But in 1983, financial deregulation happened and the Australian dollar was floated. That changed the rules of the game. From then on, credit became the engine.
Four cycles in, and the pattern is clear. The drivers of each upswing were different. But the trigger for almost every downturn was the same: interest rates and credit. Tighten, and prices fall. Loosen, and prices rise.
Before we keep going — if anything in today's video has you thinking about your own situation, there are two ways to get real answers. A free 15-minute call with one of our property investment strategists — bring your questions, get a straight answer, no strings. Or if you want the full done-for-you path — strategy, lending, property selection, portfolio, tax structure, wealth planning, all of it — book a free 30-minute Discovery Session and see how VISION Gold Membership actually works. Both links are in the description. Alright, let's get back to it.
Cycle five, 1983 to 1991. After deregulation, credit exploded. After the 1987 global stock crash, money poured out of shares and into property. Prices surged 22.5% in 1988 and 24.6% in 1989. People were calling bubbles, sounding almost identical to today. Then the RBA pushed rates to around 17%. National prices fell 8%. Melbourne dropped 20% and didn’t come back until 1996. Pyramid Building Society collapsed, state banks in South Australia and Victoria went under, and unemployment hit about 11%. The bottom came when the RBA started cutting, from 17.5% all the way down to 4.75%.
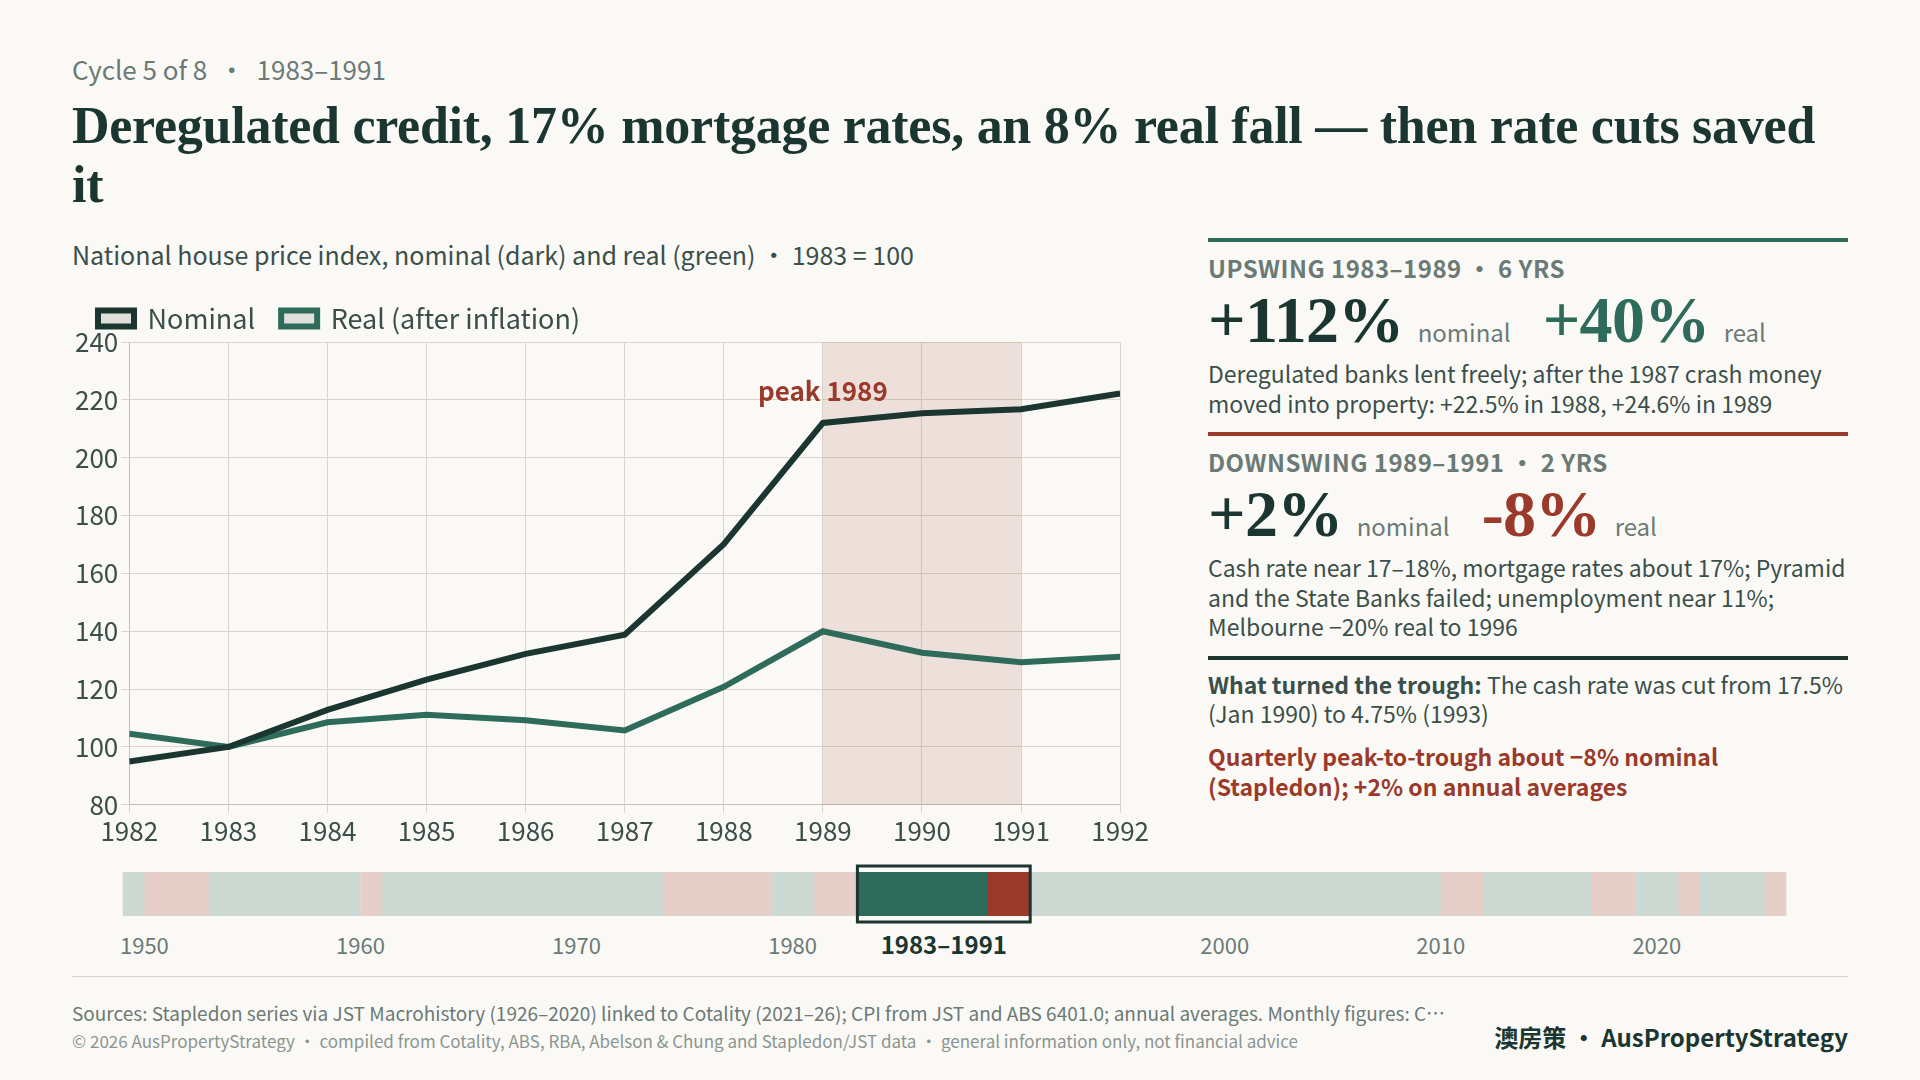
Seventeen per cent interest, eleven per cent unemployment, and banks going under. Under those conditions, national prices only fell 8%. Right now rates are at 4.35%, and someone is telling you prices will drop 13%. Think about that.
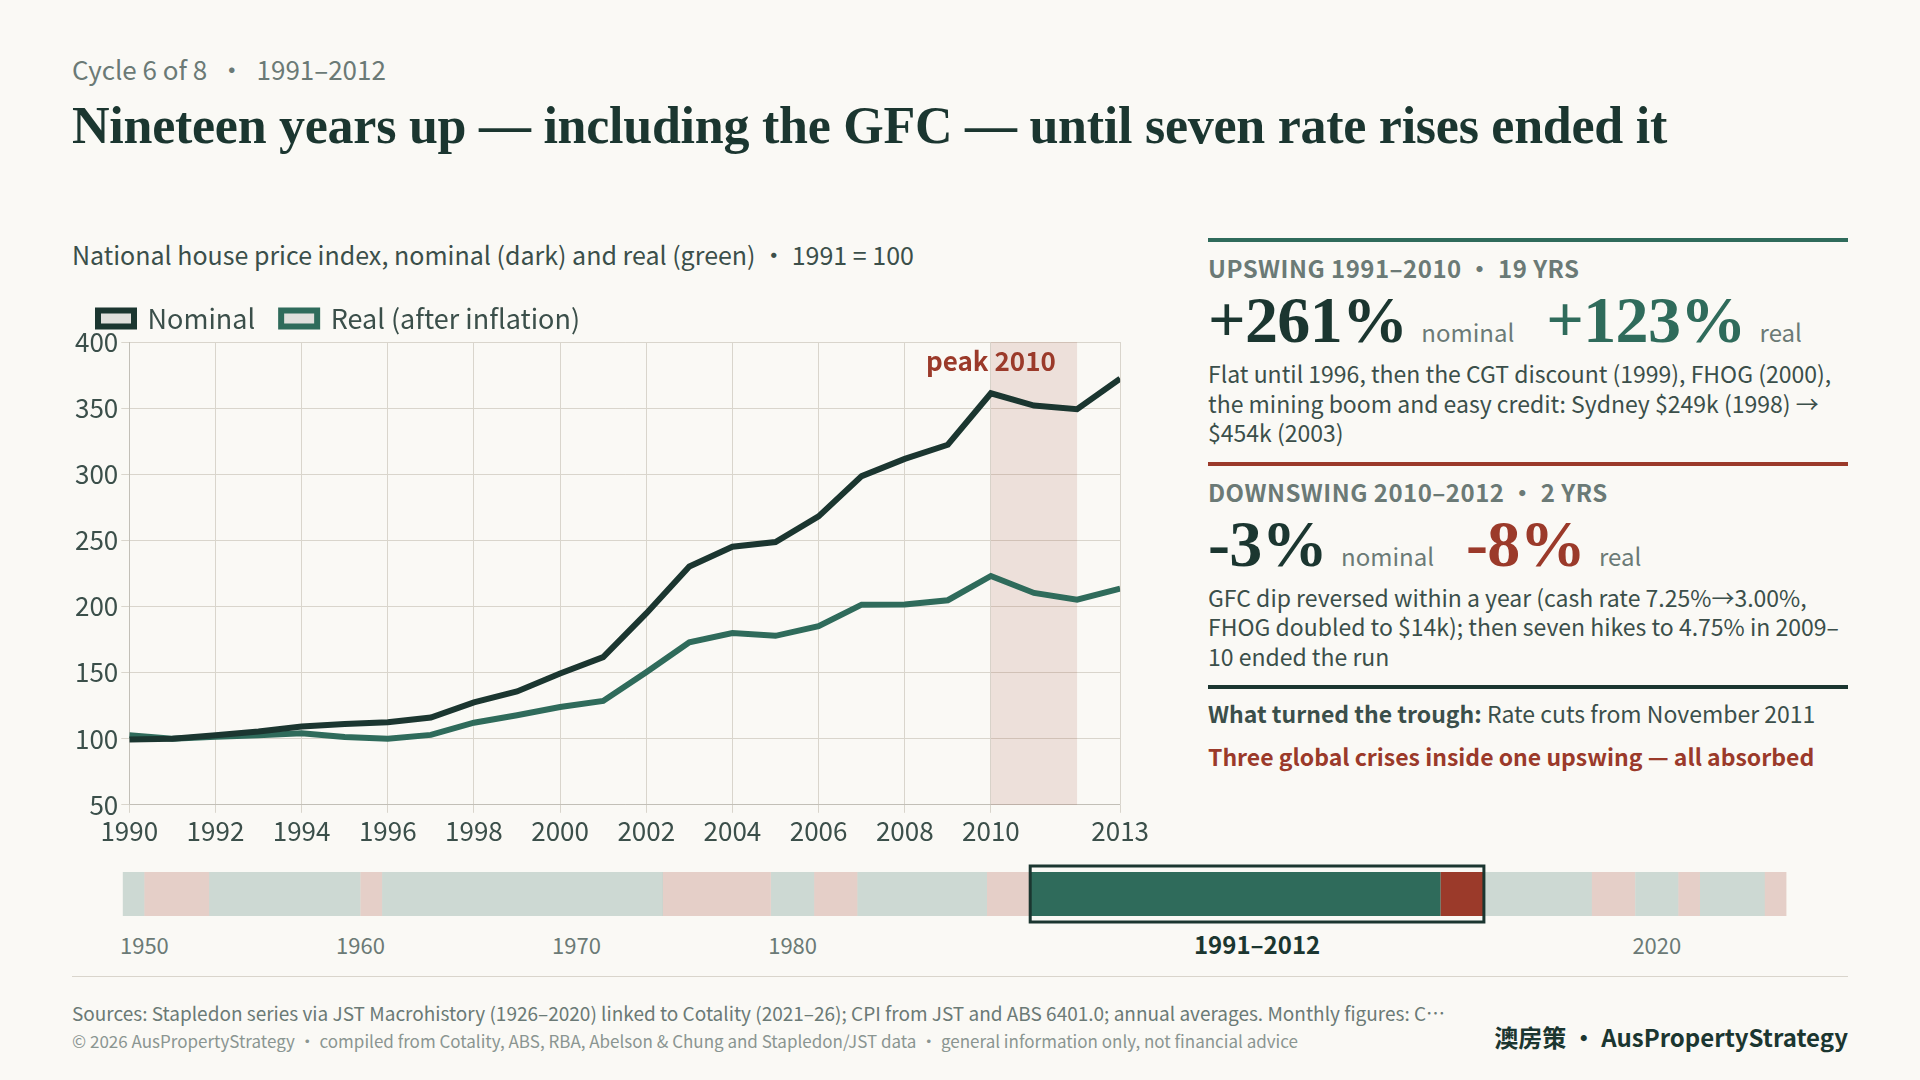
Cycle six, 1991 to 2012. A 19-year bull market. The first 5 years were flat as high unemployment was slowly absorbed. The acceleration started after 1996. The 1999 CGT discount amplified negative gearing. The 2000 first home owner grant pushed prices higher. Sydney’s median went from $250,000 in 1998 to $450,000 by 2003. Then the 2005 to 2008 mining boom nearly doubled Perth prices in 3 years. Over those 19 years, the market went through three economic crises and came out the other side each time. The biggest was 2008. Property in the United States crashed over 30%, and the big banks predicted Australia would follow. Instead, the government doubled the first home owner grant to $14,000, and the RBA cut rates from 7.25% to 3% in under a year. The dip was fully recovered within 12 months. That bull run finally ended when 7 hikes pushed rates to 4.75% by 2010. National prices fell 8%. Rate cuts kicked in from November 2011. Once again, the reason was interest rates.
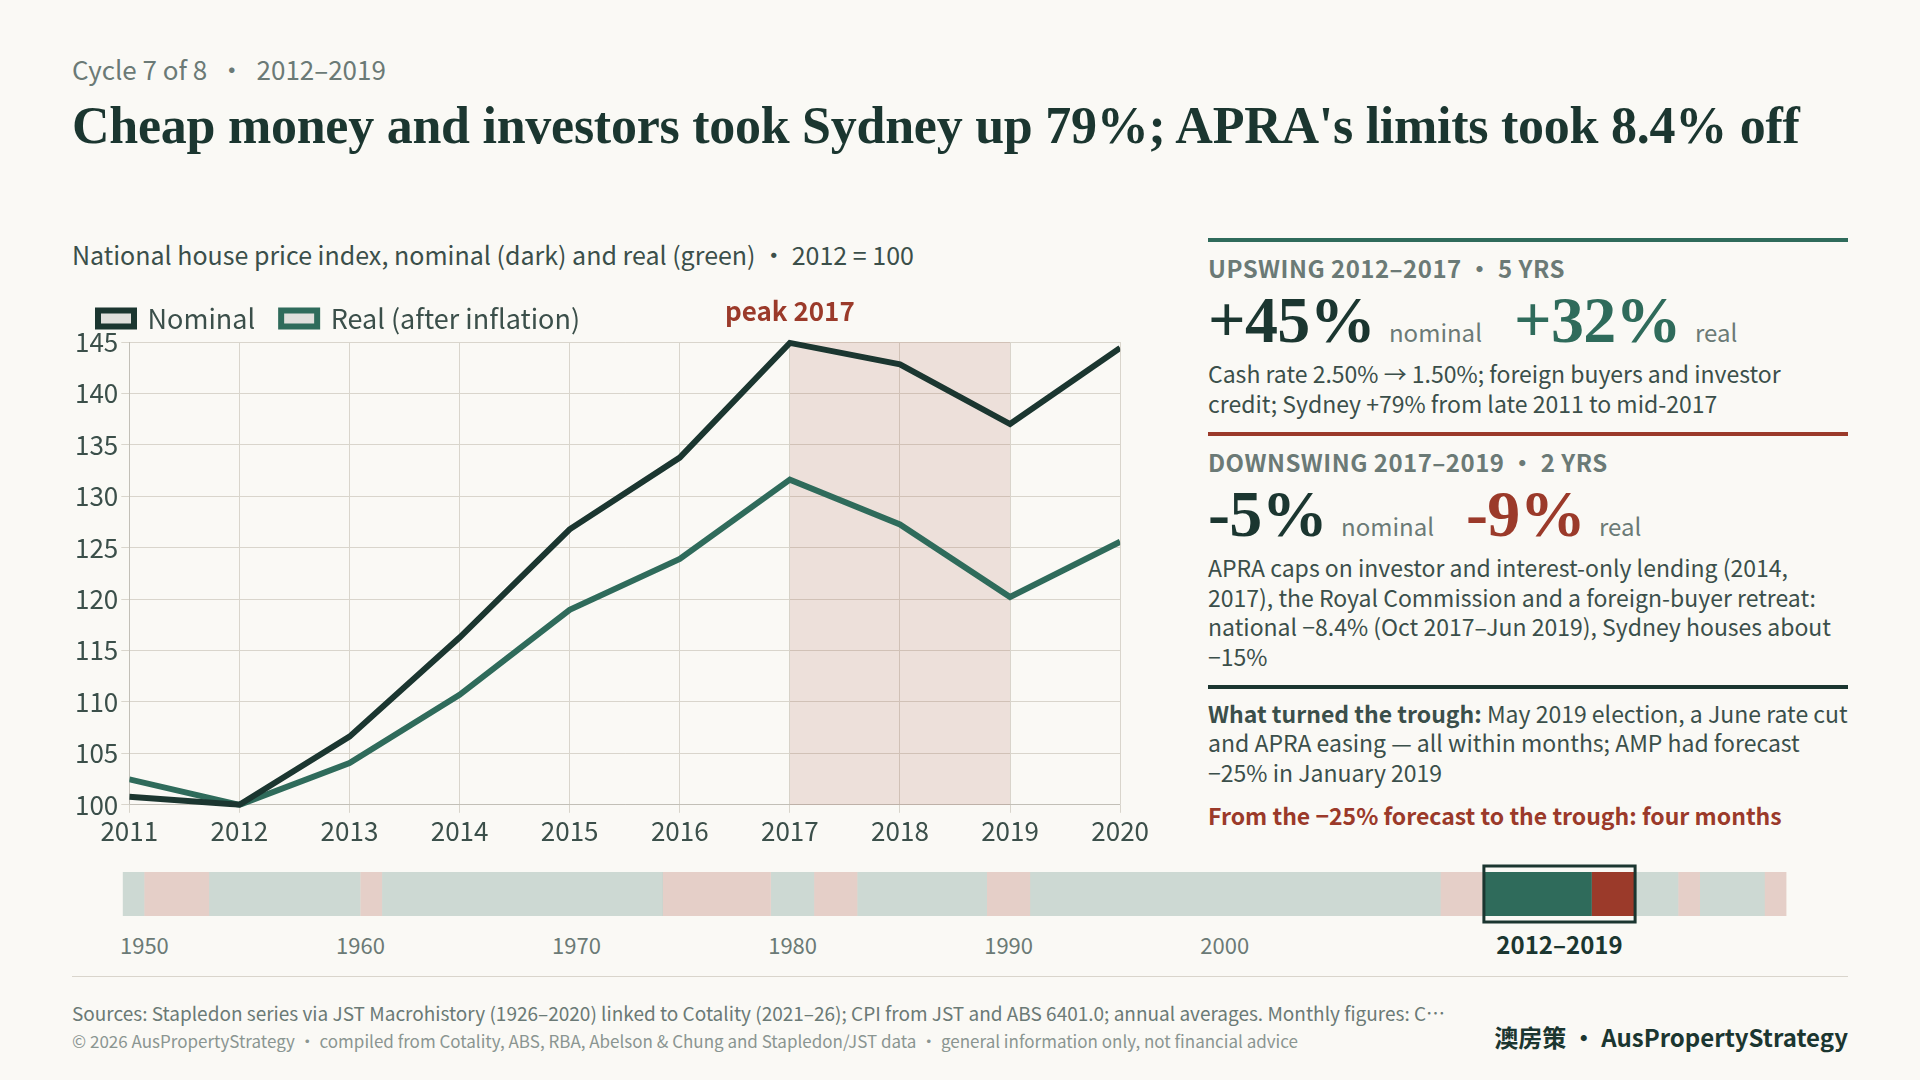
Cycle seven, 2012 to 2019. Rates were cut from 2.50% to 1.50%. Overseas buyers poured in, investor lending took off, and Sydney prices rose 79% in 5 years. Then APRA capped investor loan growth and restricted interest-only lending. After the Royal Commission tightened standards further, national prices fell 8.4%, with Sydney down 14.9%. In January 2019, right at the bottom, AMP called for a 25% national decline. Then three things happened in quick succession. In May, the party that wanted to change negative gearing lost the federal election. In June, the RBA cut rates. That same month, APRA loosened the lending assessment rate. From AMP’s 25% call to the market bouncing back, just 4 months.
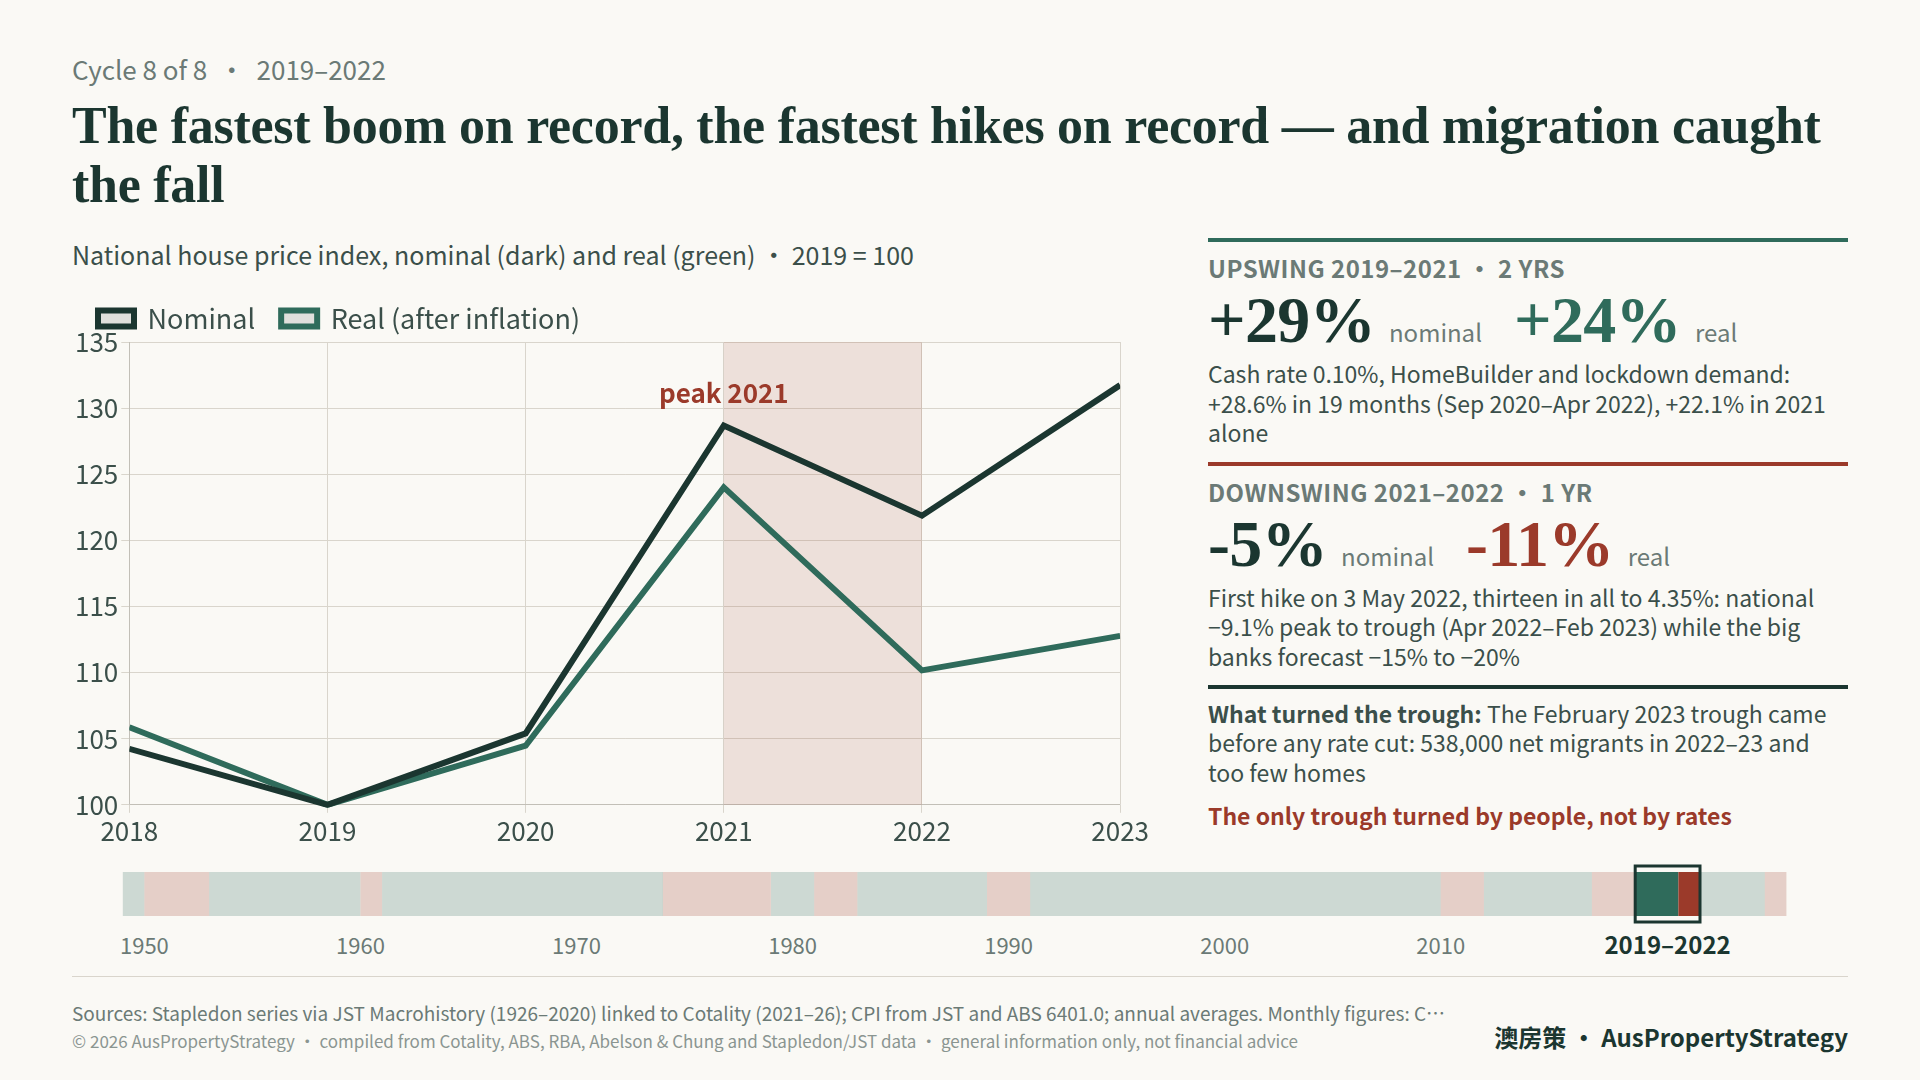
Cycle eight, 2019 to 2023. Rates were cut to 0.10%, stimulus including HomeBuilder poured in, and post-lockdown demand surged. In 19 months prices shot up 28.6%, the fastest bull run on record. Then the RBA started hiking on May 3rd 2022. Over 10 months prices dropped 8.4%, and the big four were all calling for 15% to 20% declines. The market bottomed in February 2023, not because of rate cuts, those didn’t come until February 2025, but because 538,000 people came into Australia through migration that year, a record, and there simply weren’t enough homes to go around. Population held prices up. The only cycle out of eight where the bottom wasn’t triggered by rate cuts.
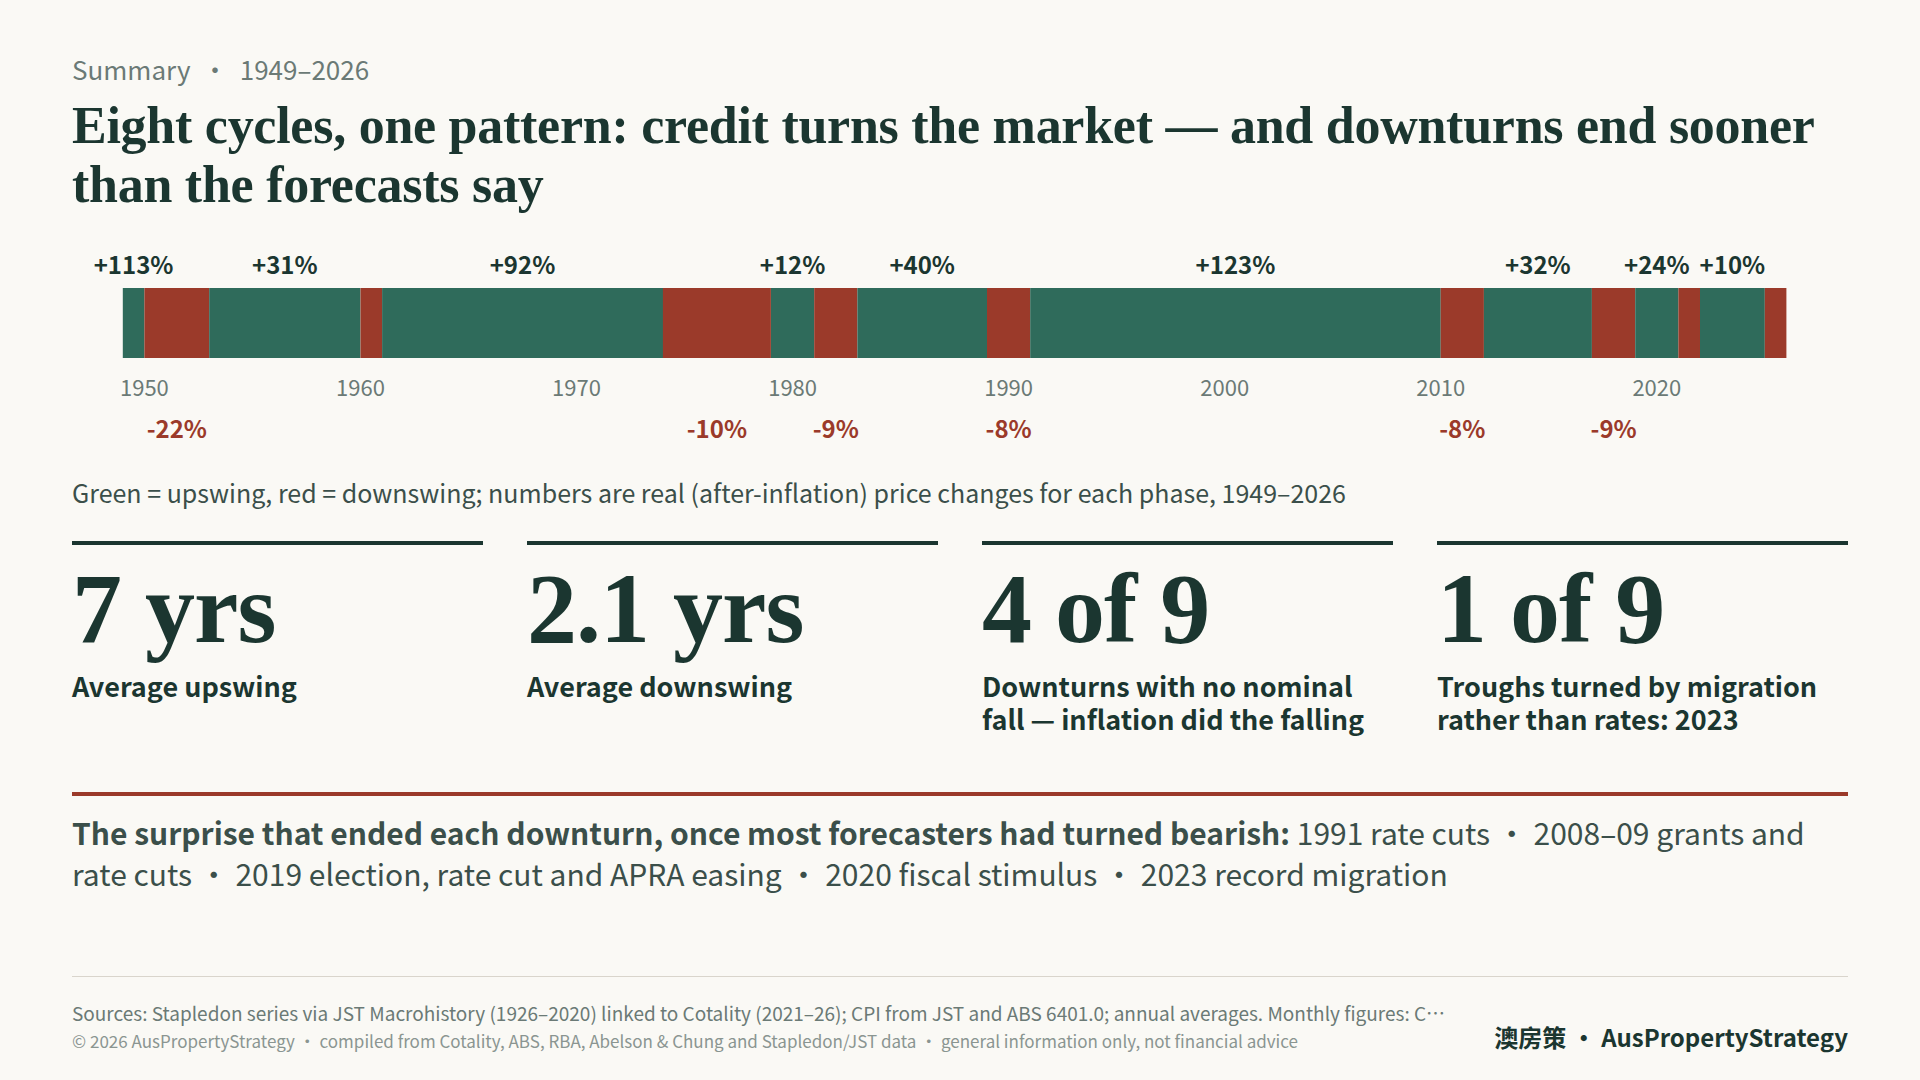
All 8 together. The average upswing lasts about 7 years. The average downturn, about 2.1 years. In 4 of the 9 downturns, nominal prices didn’t actually fall at all. Almost every peak and trough was triggered by interest rates and credit, with the sole exception being 2023’s migration-driven bottom. And at least 5 times, the same thing played out: during the downturn, more institutions piled on with bearish calls, then an unexpected variable showed up and the market bottomed earlier than anyone predicted. In 1989, rate cuts. In 2008, the first home owner grant plus rate cuts. In 2019, the election plus rate cuts plus APRA. In 2020, massive fiscal stimulus. In 2023, migration.
Eight cycles. Every time, prices came back. But you must be wondering: what about this time?
This Time Is the Same
National prices have already dropped from the peak. If you go by the historical average of roughly 2 years and roughly 10%, this cycle may have already covered between a third and half of its distance.
I’m not saying there aren’t differences this time. But I am saying the structure hasn’t changed. There are three variables worth watching. First, the RBA is still leaning hawkish, with rates at 4.35% and market pricing for the September 28-29 meeting putting the probability of a hike above 50%. If rates hit 4.60%, that squeezes borrowing capacity further. Second, the negative gearing and CGT reform taking effect July 1st 2027 is a negative signal on its own. Third, immigration policy is under tightening discussion, so there won’t be another 538,000 arrivals in a year.
But every cycle had its version of “this time is different.” In 1989, banks were collapsing. In 2008, a global financial crisis. In 2020, a pandemic shut the world down. In 2022, rates were rising at the fastest pace on record. Every one sounded perfectly reasonable. Every one ended the same way. My view is unchanged. I still think there’s a possibility of a bottom forming in the first or second quarter of next year.
Seventy-five years of data tells you one thing. Whether banks call for 9% or 13%, those numbers don’t matter. What matters is the switch. Look back, and almost every time prices found a bottom, it was because the policy direction changed. In June 2019 the RBA cut rates, and prices bottomed the same month. In February 2023, the market started believing rates wouldn't go any higher, and prices bottomed the same month. That's the point. Prices don't fall to a certain number and stop on their own. The moment the policy direction changes, the market reacts immediately. The policy wind shifts, and the market reacts immediately. So the one thing you should be watching is this: when does the RBA stop hiking, or when does it start cutting? That matters more than any number any bank gives you.
And here’s what most people overlook. The window at the bottom is extremely short. In 2019, AMP called for 25% in January and the market bottomed in May, just four months later. In 2023, the big four called for 15% to 20% and the bottom came in 10 months. Both times, by the time you could confirm the fall was over, prices had already moved a long way. So the real question isn’t “will it keep falling.” It’s what you’ve been doing to prepare while prices are down.
Seventy-five years of data says the average cycle is 7 years up and 2 years down. Every time someone said “this time it’s going to crash,” prices came back. Are you going to spend the 2-year window in panic, or use it to get ready for the next 7 years of growth?
Watch the video version of the blog on YouTube.
15 Minutes Free Consultation (Limited-Time Free Offer)
If you have any questions about Australian real estate, we invite you to use our 15 Minutes Free Consultation service. Once you have filled in the form, a professional property investment strategist will be in touch with you. They will assess your needs and provide fundamental advice. This service is designed to help answer general property-related queries. BOOK NOW.
VISION Membership
Our Flagship Service: VISION Membership. Your One-Stop Property Investment Manager – Build a Tailored Portfolio and Achieve Financial Freedom
Whether you're an employee, a professional, a business owner or even a new migrant, everyone has a financial goal for the future. The VISION Membership is designed to solve all the pain points in your Australian property investment journey through one single, comprehensive service.
By analysing your current financial situation and long-term goals, we'll tailor a property investment plan just for you. Our team will match you with the ideal mortgage structure, tax strategies, wealth planning, and legal support, empowering you to go further, faster, and smarter on your path to financial freedom.
VISION Membership is perfect for busy individuals who want a professional team to create, expand and manage their Australian investment portfolio. If you're looking for a dedicated team, including real estate investment experts, mortgage brokers, accountants, financial planners, and property solicitors, VISION Membership is your ideal solution.
Start with an obligation-free 30-minute discovery session on Zoom. BOOK NOW.
VISION Buyer’s Agent
No time for inspections? Tired of dealing with pushy selling agents? Unsure how much to offer or feeling nervous about auctions? Worried about buying the wrong property? If any of these sound like you, AusPropertyStrategy's Australia-wide VISION Buyer's Agent Service is here to help.
We provide end-to-end support to help you build an optimised property portfolio and achieve your financial goals—whether you're investing interstate, refinancing, or planning post-settlement leasing or resale. Our services cover everything from suburb research and property selection, to price negotiation, auction bidding, and post-settlement support.
Start with an obligation-free 30-minute discovery session on Zoom. BOOK NOW.
real estate australia,real estate investing,australian property,australian housing market,australian economy,australian property investment,australian property market,buying property,australian real estate,mortgage brokers brisbane,first home buyer,Australian Real Estate,Australian Real Estate Investment,Australian Property Investment,Real Estate Investment,Property Investment,Property Investment Australia,Passive Income,Positive Cash Flow,Australia Real Estate Investing,Australian Real Estate Investors,Australian Property Investors,Vision Wealth Mentors,Vision Real Estate Investors Australia,financial freedom, freedom through property investment,real estate investors,property investment,passive income,positive cash flow,real estate course,real estate courses,real estate training,australian property market,property investment brisbane,property investment sydney,melbourne property market,investing in brisbane,investing in melbourne,how to invest in property,buying properties,start investing in property,property investment strategy,how to buy investment property,property investing tips,best suburbs to invest in sydney,locations real estate,prime location,property growth by suburb,capital growth suburbs


