

Sydney Prices Back to 2021 as RBA Hikes a 5th Time: Is It the Last?
Last updated: 2026-11-04
🔑 Key Takeaways (TL;DR)
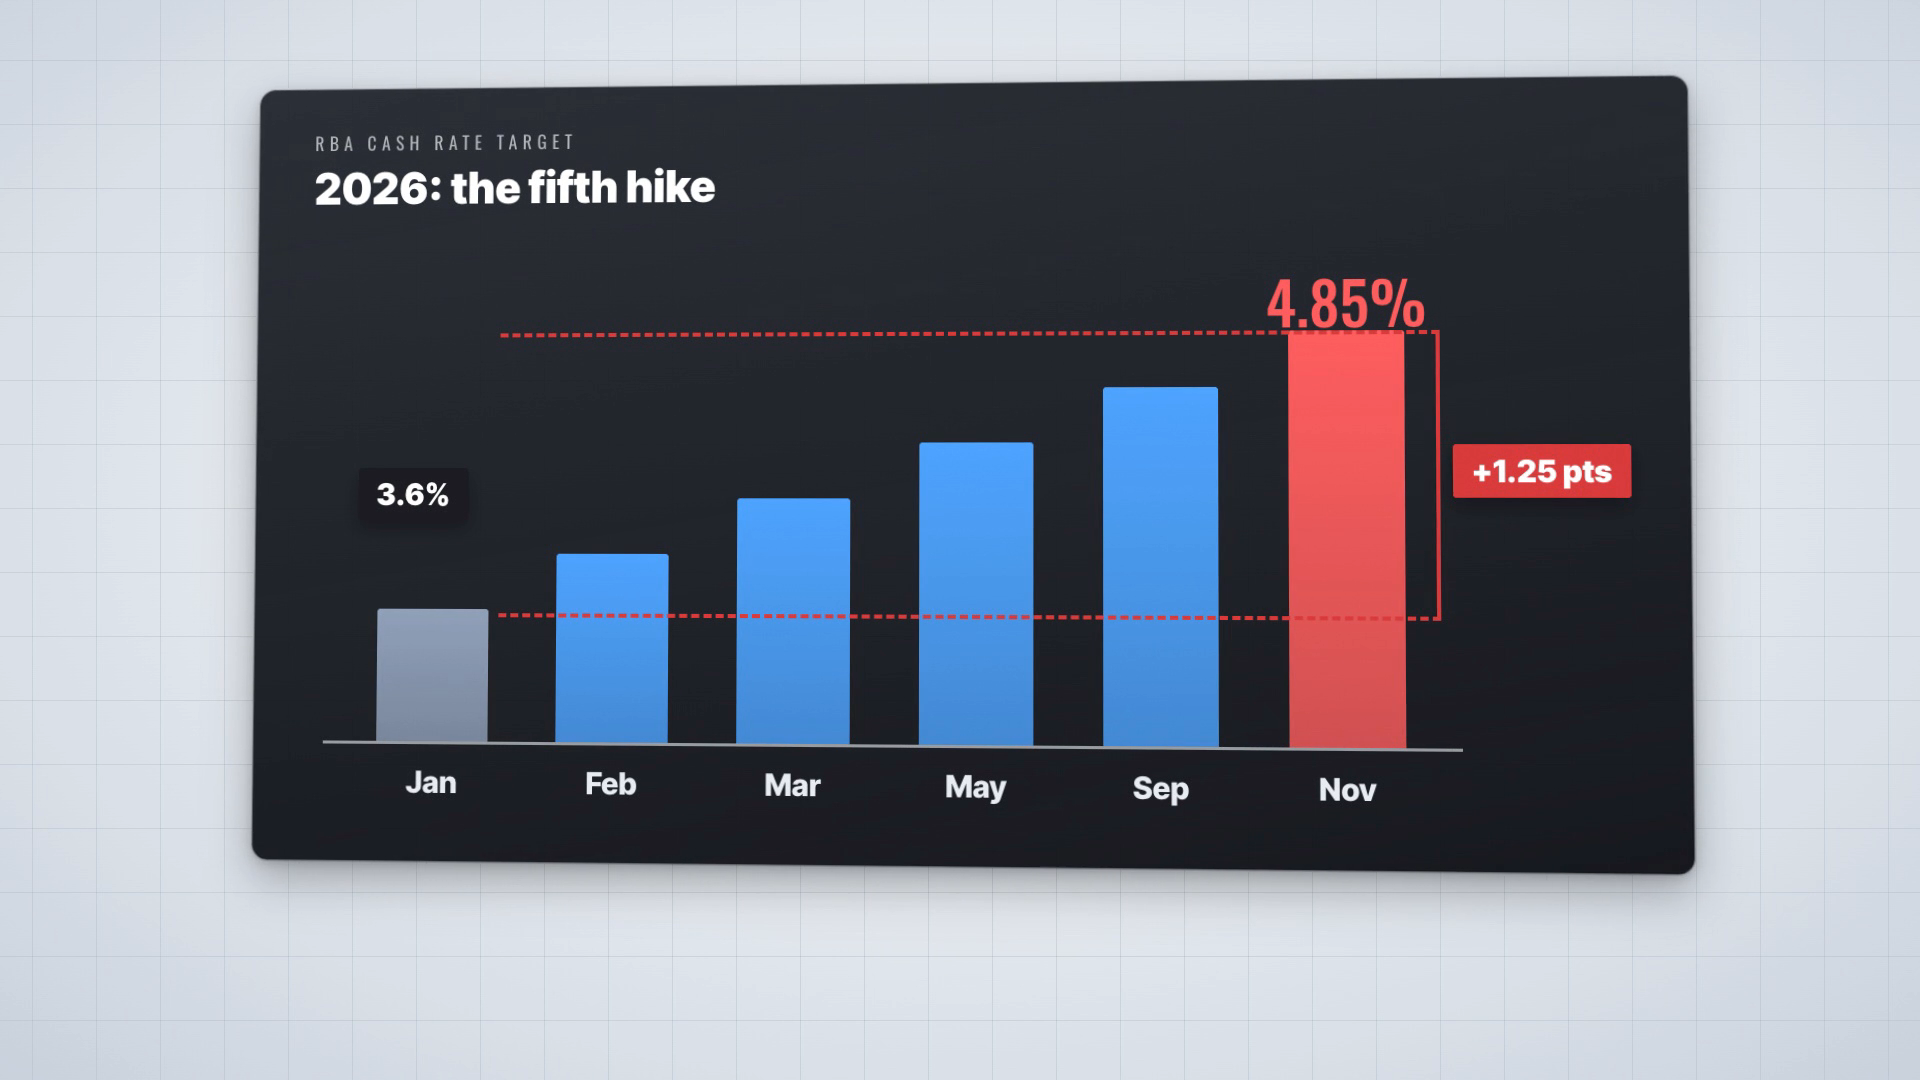
The RBA lifted the cash rate 0.25% to 4.85% on Melbourne Cup day, its fifth hike this year and the highest since 2008.
Sydney values are 10.1% below their February peak and 1.5% below October 2021 levels.
Cotality estimates this round of hikes has cut borrowing capacity by about 11.5%, or roughly $105,000.
Three dates to watch: November 19th (jobs), November 25th (inflation) and December 8th (RBA decision).
Contents
Why Did the RBA Raise the Cash Rate to 4.85%?
How Fast Are Australian House Prices Falling?
Why Are Sydney House Prices Back to 2021 Levels?
Why Are Brisbane and Perth Now Leading the Falls?
Why Is the RBA Still Hiking While House Prices Fall?
How Does an RBA Rate Hike Cut What You Can Borrow?
What Do Negative Gearing and a Higher LVR Mean for Investors?
Is This the Last RBA Rate Hike, and When Will Prices Bottom?
Frequently Asked Questions
What Will Decide When House Prices Stop Falling?
This RBA rate hike landed while Australian house prices were already falling. National values have dropped for seven months, capital city values are falling at the fastest pace in 40 years, and Sydney home values have slipped back to where they were five years ago. Yet the RBA put rates up for the fifth time this year.
On a $1 million mortgage, this year's hikes add over $800 a month to your repayments, or over $1,000 a month on an interest-only investment loan. I've gone through Cotality's October report alongside this hike, and there's an important pattern in there most people miss. This article is based on my latest AusPropertyStrategy episode. Watch the full APS182 video on YouTube →
Figures below are city-wide averages, and forecasts are only forecasts. This is general information, not financial advice.
Why Did the RBA Raise the Cash Rate to 4.85%?
The RBA rate hike on Melbourne Cup day lifted the cash rate 0.25% to 4.85%. It was the fifth hike this year, after February, March, May and September, and it took the cash rate up 1.25% from 3.6% in January. That's the highest level since 2008.
Nobody in the market was surprised by this RBA rate hike. All four major banks, CBA, Westpac, NAB and ANZ, had forecast 4.85%, and futures markets had priced in about an 80% chance of a hike. The reaction was calm, but even an expected hike still hurts households, mentally and financially.
The announcement came on Tuesday afternoon, before the Melbourne Cup had even started. At the track, people were betting on which horse would win. The RBA was betting on whether it could hold inflation down.
So how high is 4.85%? Back in 2008, during the Global Financial Crisis, the RBA passed this level on its way down from 7%. This time, the rate climbed step by step. If you took out your mortgage after 2008, you've never seen a cash rate this high.
Two of the banks, CBA and NAB, had been calling a hold. They changed their call the same day the inflation figures came out on October 28th, so the market had done the maths well before the meeting. Borrowing now costs more, and prices had already been falling for more than half a year before this hike.
Measure | Figure | What it means |
Cash rate in January | 3.6% | Where the year started |
Cash rate after the Melbourne Cup day hike | 4.85% | The highest since 2008 |
Rise this year | 1.25% over five hikes | February, March, May, September and November |
Extra repayments on a $1 million mortgage | Over $800 a month | From this year's hikes |
Extra repayments on an interest-only investment loan | Over $1,000 a month | From this year's hikes |
How Fast Are Australian House Prices Falling?
Australian house prices fell 1.2% nationally in October and are now 6.7% below the March peak, according to Cotality. That's about $63,000 off the national median value. Averaged out from March to October, it's like waking up every morning with about $300 knocked off a median-priced home.
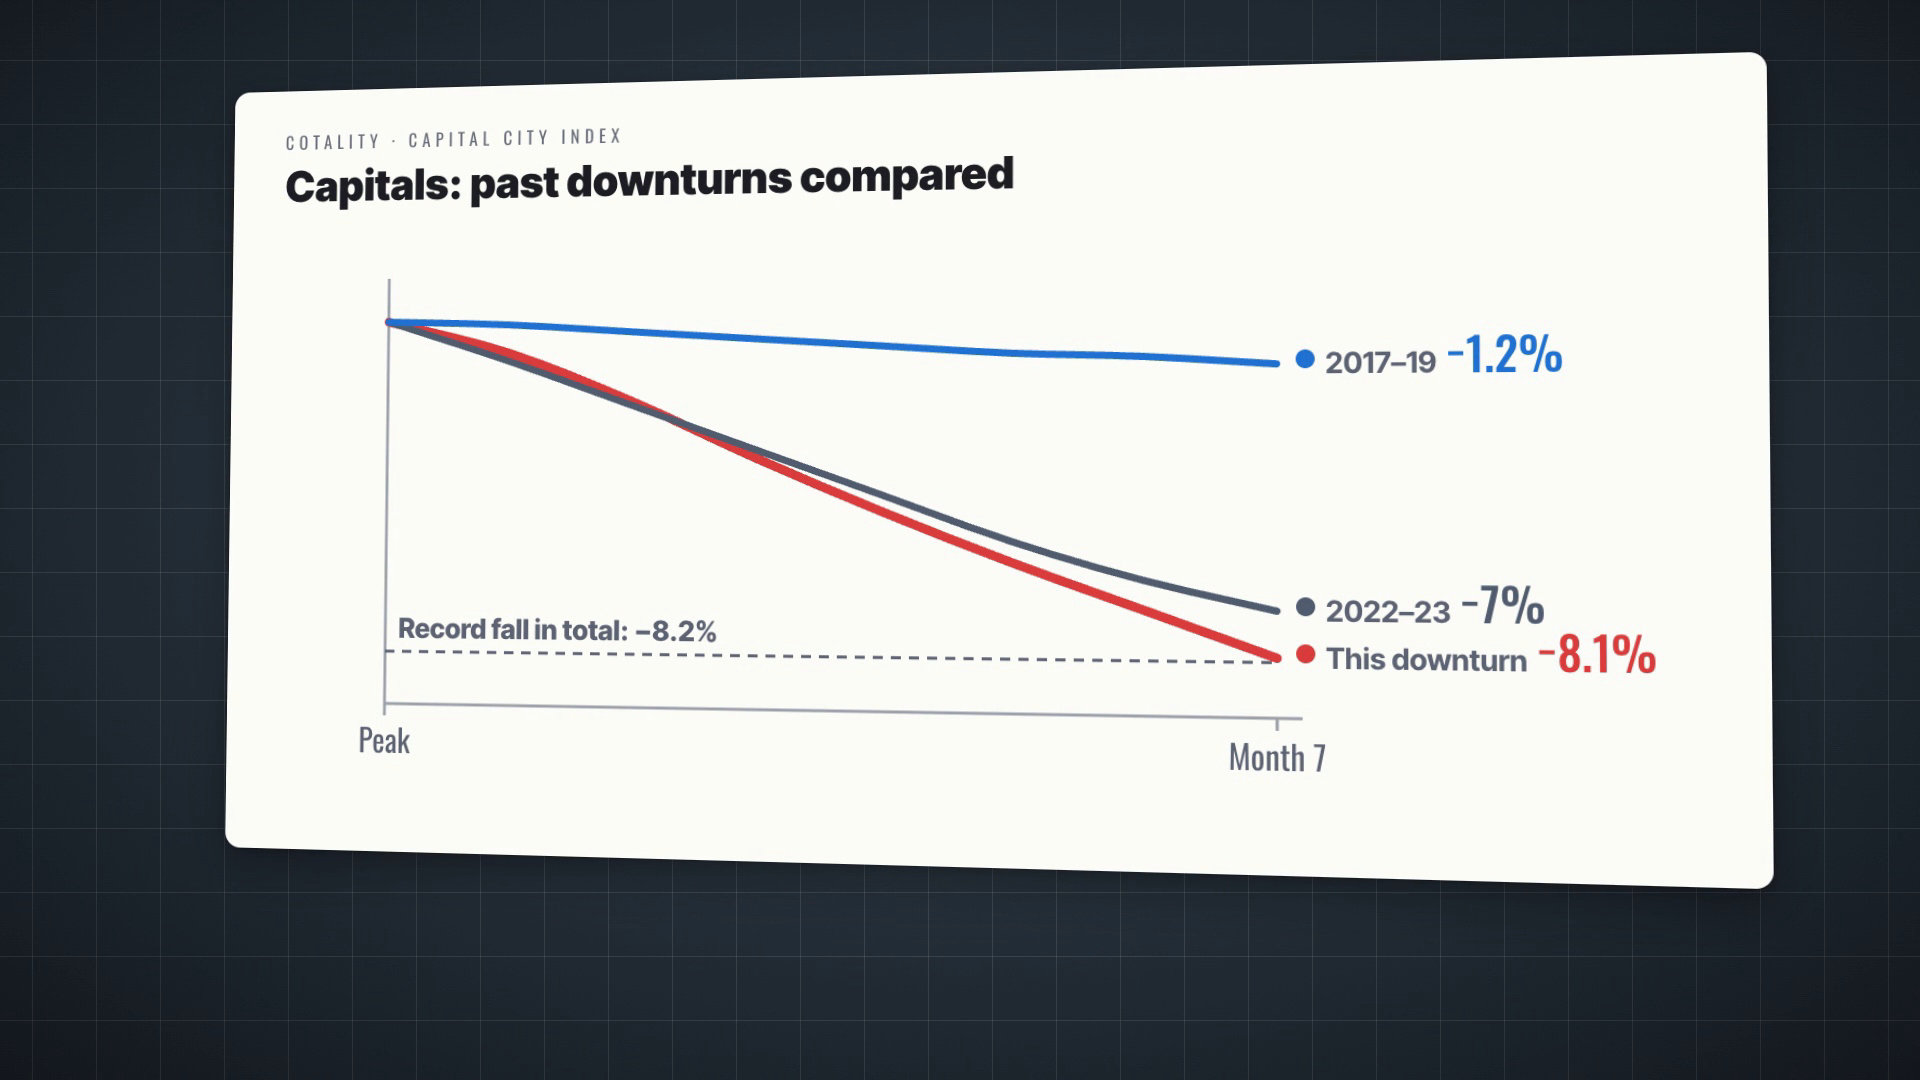
Capital city values have fallen further, down 8.1% in the seven months since their peak. This downturn is already the fastest, it's only 0.1% short of the deepest, and Cotality expects it to become the largest decline in at least 40 years.
Cotality, formerly CoreLogic, released its October home value report on November 2nd. The speed is what stands out. The 2022 to 2023 downturn saw a 7% fall over its first seven months, and the 2017 to 2019 downturn saw just 1.2%.
In total, values fell 8.2% in that 2017 downturn, the largest on record. The capitals are now down 8.1% after only seven months, which is why this downturn is on track to pass it.
Prices have now fallen for seven months in a row, and this rate hike arrived on top of that. If you already own property in Australia, falling prices and rising rates both affect you, whether you live in it or hold it as an investment.
Downturn | Capital city fall over its first seven months | Note |
2017 to 2019 | 1.2% | Total fall of 8.2%, the largest on record |
2022 to 2023 | 7% | A faster start than 2017 |
Current downturn | 8.1% | Already the fastest, and 0.1% short of the deepest |
Why Are Sydney House Prices Back to 2021 Levels?
Sydney house prices fell 1.6% in October and are down 10.1% from their February peak, a double-digit fall. Cotality compared Sydney today with five years ago, and values are now 1.5% below October 2021 levels. If you bought there five years ago, you've ridden a five-year roller coaster back to where you started.
Melbourne fell 0.8% in October and is 7.3% lower than five years ago. It peaked in March 2022 and hadn't picked up much before this downturn began, so over the past five years Australia's two largest cities have both gone backwards.
Market activity tells the same story. Sales volumes over the past three months are 23% lower than a year earlier. Sellers are knocking 4.7% off their asking price on average, the most since May 2019. Auction clearance rates across the capitals have stayed below 50%, which means more than half the homes at auction don't sell on the day.
Of course, these are city-wide averages. Your suburb, and your own property, could be doing a bit better or a bit worse.
Plenty of people expected falls in Sydney and Melbourne. For me, the surprise this month came from the cities that rose the most over the past two years, and that's where the falls are now fastest.
Why Are Brisbane and Perth Now Leading the Falls?
Brisbane fell 2% in October, the fastest of all eight capitals, and Perth fell 1.7%. Brisbane is now 8.3% below its May peak and Perth is 8.9% below its April peak. In Cotality's view, after rising too fast, these mid-sized capitals are in a real correction.
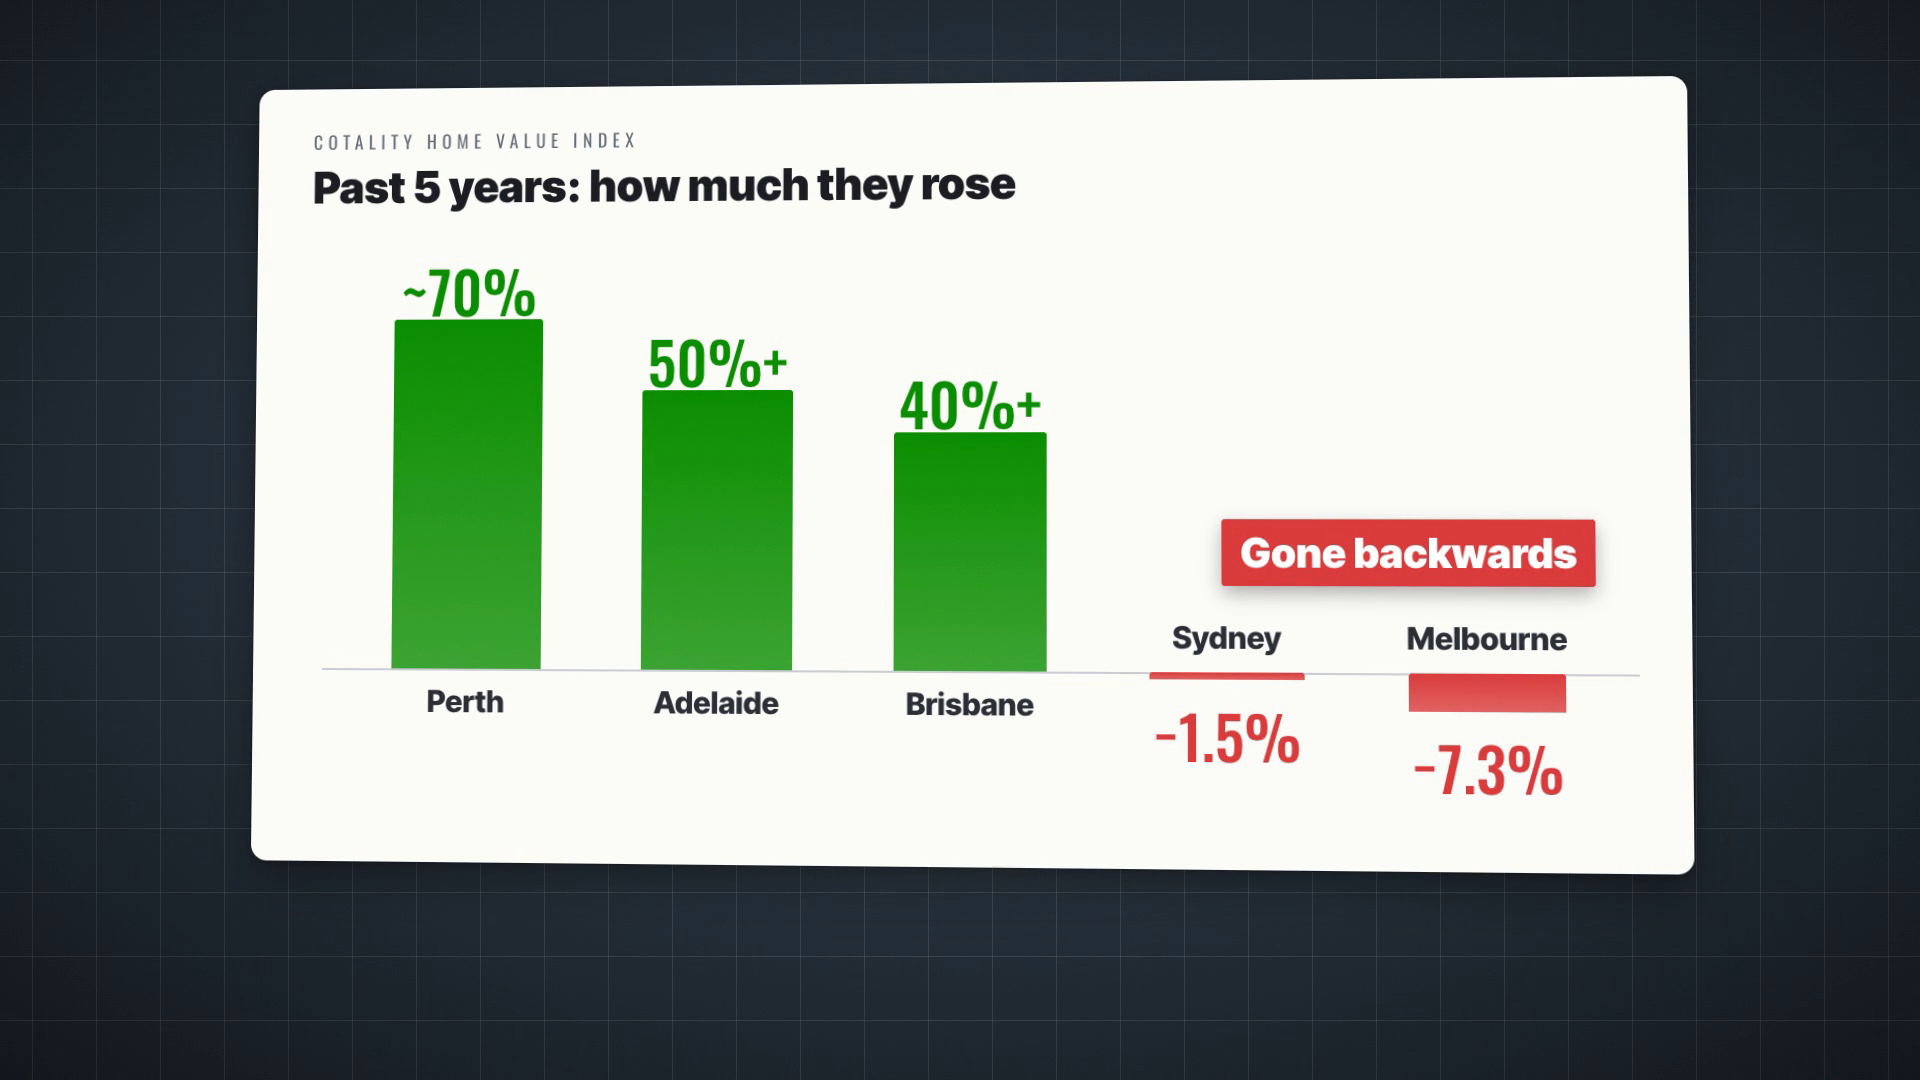
Over the past five years, Perth is up almost 70%, Adelaide more than 50% and Brisbane more than 40%, while Sydney and Melbourne have both gone backwards. Values have fallen in almost every suburb of Brisbane, Perth and Adelaide over the past three months.
In March, Brisbane was still up 19% over the year, with buyers queuing outside weekend open homes. Its sales volumes are now 29% lower than last year, and a lot of buyers have stopped showing up. Perth's swing is even bigger. Its annual growth was more than 24% in March, the strongest in the country, and it's now under 4%. In six months, Perth has gone from leading the gains to being among the cities leading the falls. The way I see it, the faster a market rises, the faster it corrects.
Should owners in Perth and Brisbane panic? I'd hold off for now. Cotality calculates that even a 20% fall from the peak would only take Perth back to mid-2025 levels. If you bought a few years ago, your gains give you more equity to absorb a fall. The real pressure is on people who bought near the peak in the last year or two and borrowed close to their limit, especially if they bought an established home.
City | October change | Longer view |
Brisbane | Fell 2%, the fastest of the eight capitals | 8.3% below its May peak; up more than 40% over five years |
Perth | Fell 1.7% | 8.9% below its April peak; still up close to 4% over the year |
Adelaide | Fell 1.2% | Still up 3.7% over the year; up more than 50% over five years |
Sydney | Fell 1.6% | 10.1% below its February peak; 1.5% below October 2021 |
Melbourne | Fell 0.8% | 7.3% lower than five years ago |
Hobart and Darwin | Rose 0.5% and 0.6% | The only capitals to rise; median values around $740,000 and $640,000 |
📌 Thinking about your own situation?
Book a free 15-minute call with one of our property investment strategists and get a straight answer, no strings. For the full done-for-you path, from strategy, lending and property selection to portfolio, tax structure and wealth planning, book a free 30-minute Discovery Session and see how VISION Gold Membership works.
Why Is the RBA Still Hiking While House Prices Fall?
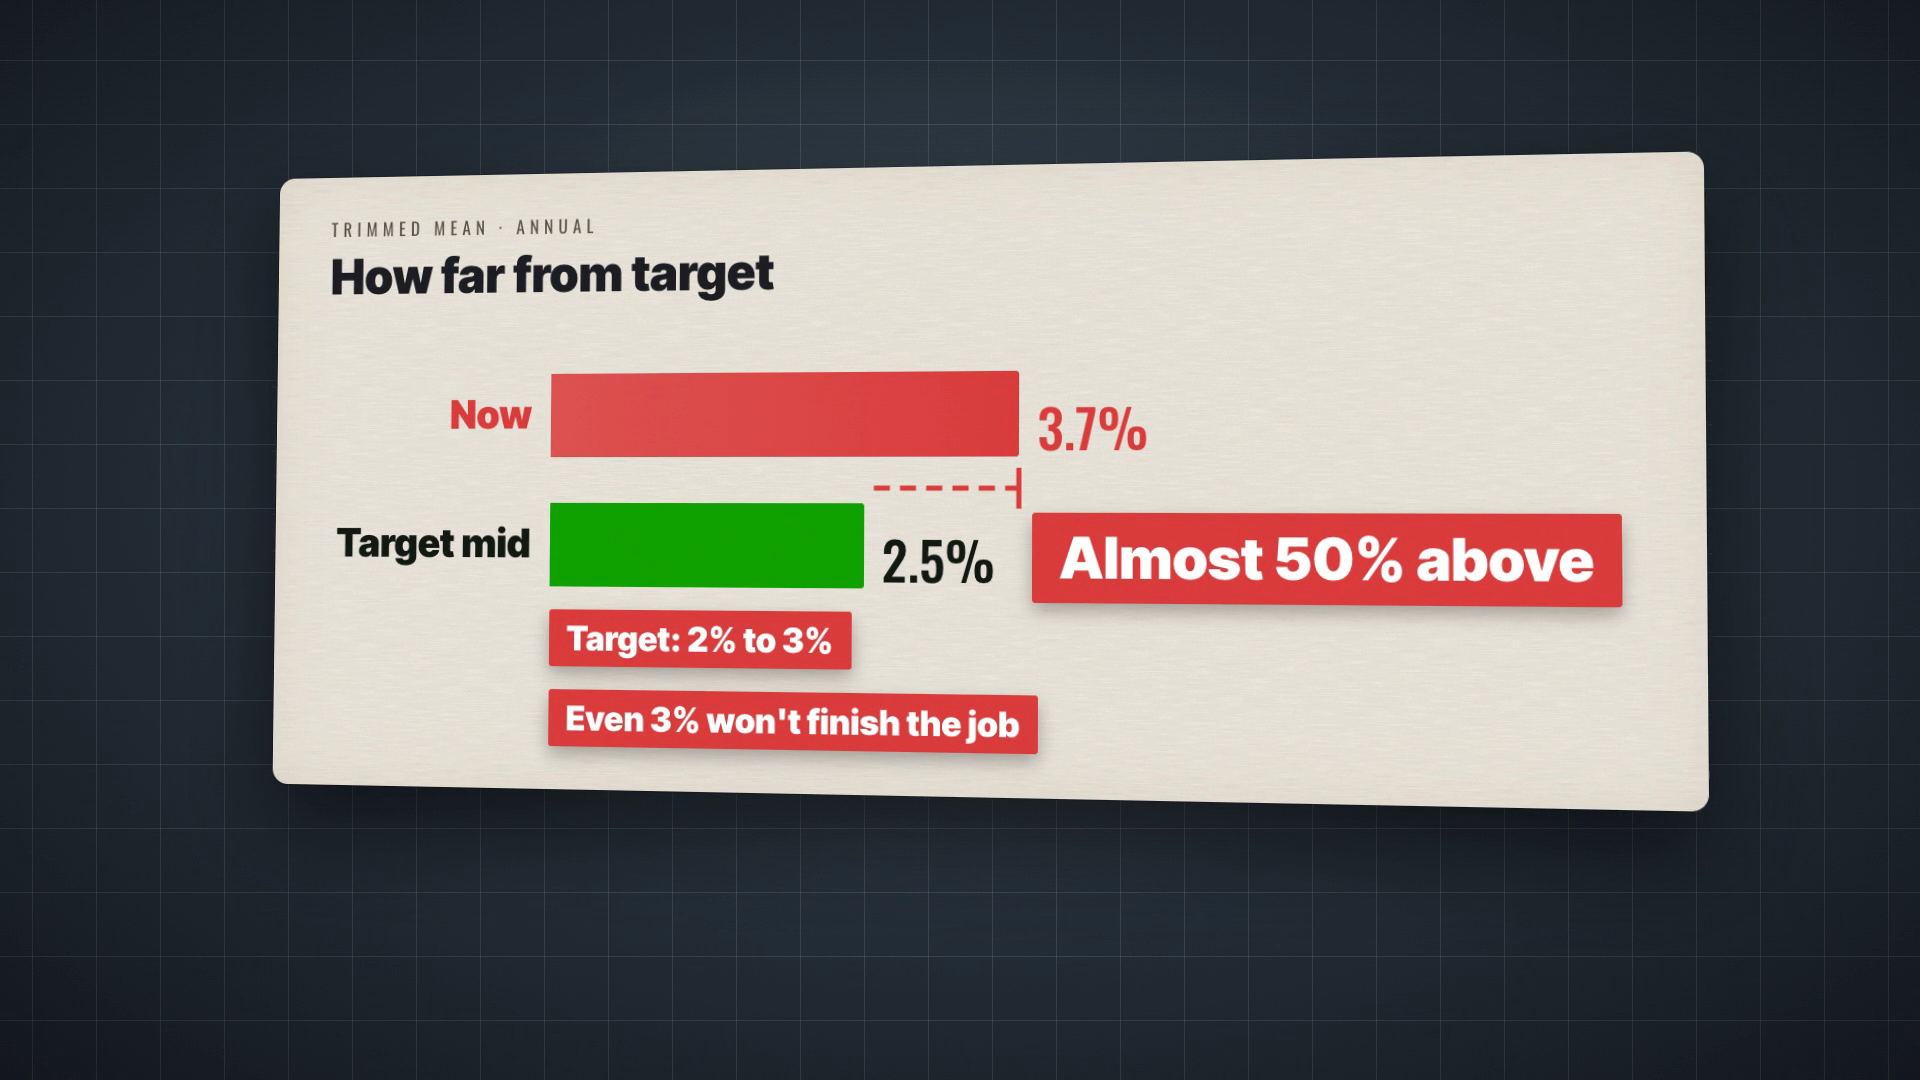
The RBA has two jobs: keeping inflation between 2% and 3%, and making sure people who want work can find it. House prices aren't on the list. Trimmed mean inflation is up 3.7% over the year, almost 50% above the 2.5% midpoint, so the RBA has put inflation first.
The ABS figures released on October 28th showed September prices 4.3% higher than a year earlier, up from 4% in August. Trimmed mean inflation rose 1% in the September quarter, against the RBA's own August forecast of 0.8%. Even reaching 3% wouldn't finish the job.
Trimmed mean strips out the biggest price rises and falls to show how fast most prices are rising, and it's the measure the RBA watches most closely. The biggest driver is the opposite of what you'd expect: housing, up 5.2% over the year. In the ABS inflation figures, housing covers rents, the cost of building new homes, and utilities like water and electricity. Existing home prices aren't counted at all, so home prices fall while the housing part of inflation still goes up.
Employment, the second job, is already weakening, and the economy is clearly slowing down. But slowing down isn't a recession, and nobody official is calling it one. The minutes of the RBA's September meeting show the board discussed the effects of falling house prices and noted that the hit to spending tends to be relatively modest. My view is that the RBA sees inflation as far more dangerous. Once price rises flow into wages, businesses put prices up again to cover those wages, and the cycle feeds itself. So the RBA would rather hike once more now than several more times later.
Gauge | Latest figure | Why it matters to the RBA |
Headline inflation (September) | 4.3% over the year, up from 4% in August | Still above the 2% to 3% target |
Trimmed mean (September quarter) | Up 1% against a forecast of 0.8%; 3.7% over the year | Almost 50% above the 2.5% midpoint |
Housing in the inflation figures | Up 5.2% over the year | Rents, building costs and utilities, not existing home prices |
Transport | Up 8.7% over the year | Fuel is pushing inflation up |
Unemployment (September) | 4.7%, the highest since 2021; 39,000 jobs lost in a month | The jobs side is weakening |
Consumer sentiment (October) | 80.4 | Almost 20 points below the 100 line between optimism and pessimism |
How Does an RBA Rate Hike Cut What You Can Borrow?
Borrowing capacity is the first link between an RBA rate hike and your home's price. Banks test whether you can afford a loan at your actual rate plus 3%, the serviceability buffer set by APRA, the banking regulator. Cotality estimates this round of hikes has cut what a borrower can get by about 11.5%, or roughly $105,000.
After this hike, the average variable rate on owner-occupier loans is about 6.7%, so the test rate is around 9.7%. Your income has to cope with a rate of nearly 10% before a bank will lend to you, and borrowing capacity has fallen faster than prices.
That's the odd part. Homes have become cheaper, but for buyers they're even further out of reach.
It also explains the city pattern. My read is that the mid-sized capitals rose the most in recent years, so their prices moved furthest from what an ordinary household can borrow. When borrowing capacity shrinks, they're the first cities buyers give up on. Cotality says buyers now have more choice and more bargaining power, but they're still holding off. When buyers stay away, sellers have to cut prices.
Existing owners feel it too. Defaults haven't shown up yet, but what goes first is your room to borrow and refinance. If you're an investor switching banks, you have to pass the 3% buffer test again. If your income is earned overseas, take extra care, because banks already discount foreign income when they assess a loan.
Step | Figure | Effect on you |
Average owner-occupier variable rate | About 6.7% | What owner-occupiers pay on average after this hike |
APRA serviceability buffer | Plus 3% | Added on top in the bank's test |
Test rate | Around 9.7% | Your income has to cope with nearly 10% |
Cut to borrowing capacity (Cotality) | About 11.5%, or roughly $105,000 | Falling faster than prices |
What Do Negative Gearing and a Higher LVR Mean for Investors?
The negative gearing changes from the May federal Budget are now law, and the new rules start on July 1st, 2027. If you already owned a property before 7:30pm on May 12th, 2026, you're not affected. If you buy an established home after that, you can no longer use its losses against your wage income.
Fewer investors buying established homes means fewer buyers in that market. Cotality says the Budget has added downward pressure on prices since mid-May, and new investor loans fell 8.6% in the June quarter. Confidence is the third link, and with sentiment this low, people hold back and wait.
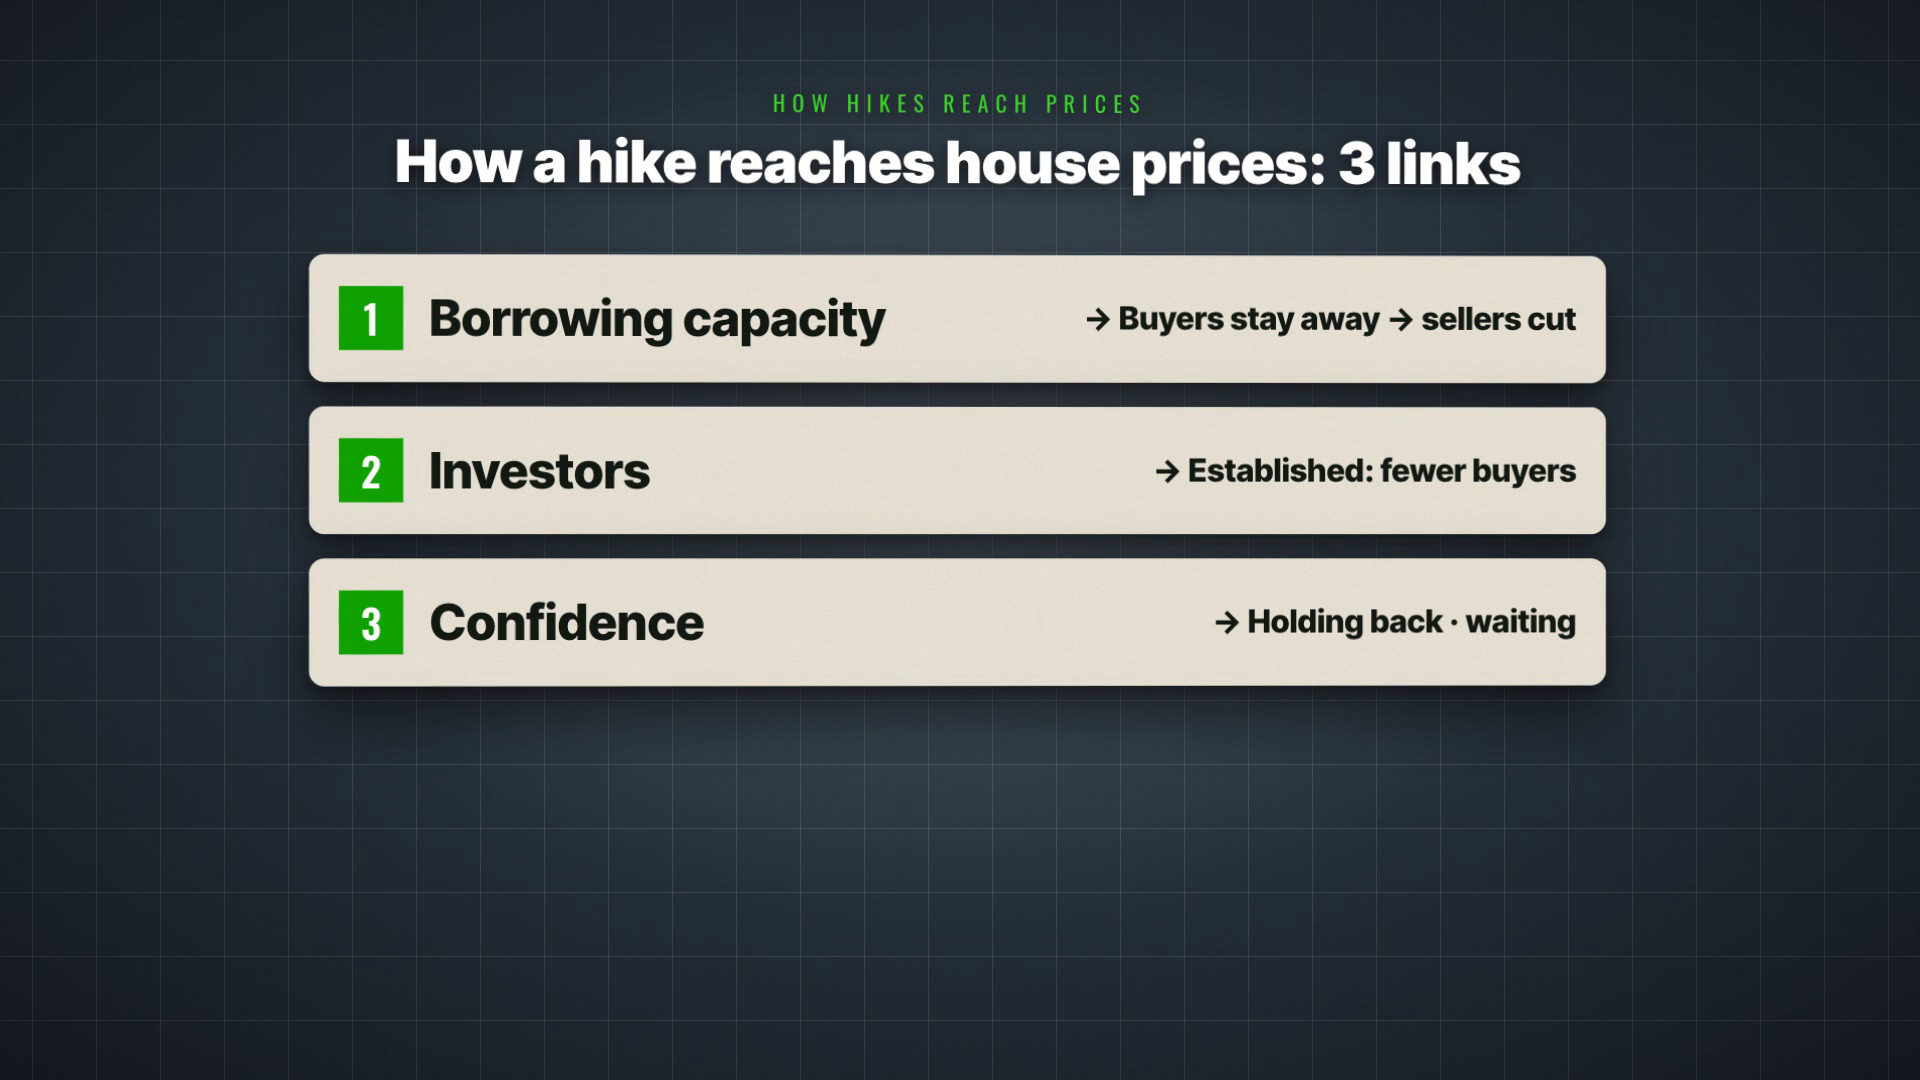
Negative gearing means using the losses on an investment property to cut the tax on your wages. All three links in the chain, borrowing capacity, investors and confidence, are about buyers. For people who already own property, the pressure shows up in the loan-to-value ratio, or LVR.
Say you bought with an 80% loan and you've only been paying interest. A 10% fall in value takes your loan to nearly 90% of what the property is worth. Above 80%, many banks will make you pay lenders mortgage insurance or won't take the loan on at all, so refinancing gets much harder.
Put the two together and an investor planning to switch banks after a fall faces both a higher LVR and the 3% buffer test again. That's the chain. Where prices go next largely comes down to how much longer rates keep rising.
Situation | Loan as a share of value | What it means |
Bought with an 80% interest-only loan | 80% | The starting point in the example |
After a 10% fall in value | Nearly 90% | Many banks charge lenders mortgage insurance or won't take the loan on |
Switching banks after the fall | Nearly 90%, plus the 3% buffer test | Refinancing gets much harder |
Is This the Last RBA Rate Hike, and When Will Prices Bottom?
The big four banks don't agree on whether this is the last RBA rate hike. CBA, NAB and Westpac expected a pause after this hike, while ANZ warns of a hike to 5.1% in December or February. Three dates will show which way it goes: November 19th, November 25th and December 8th.
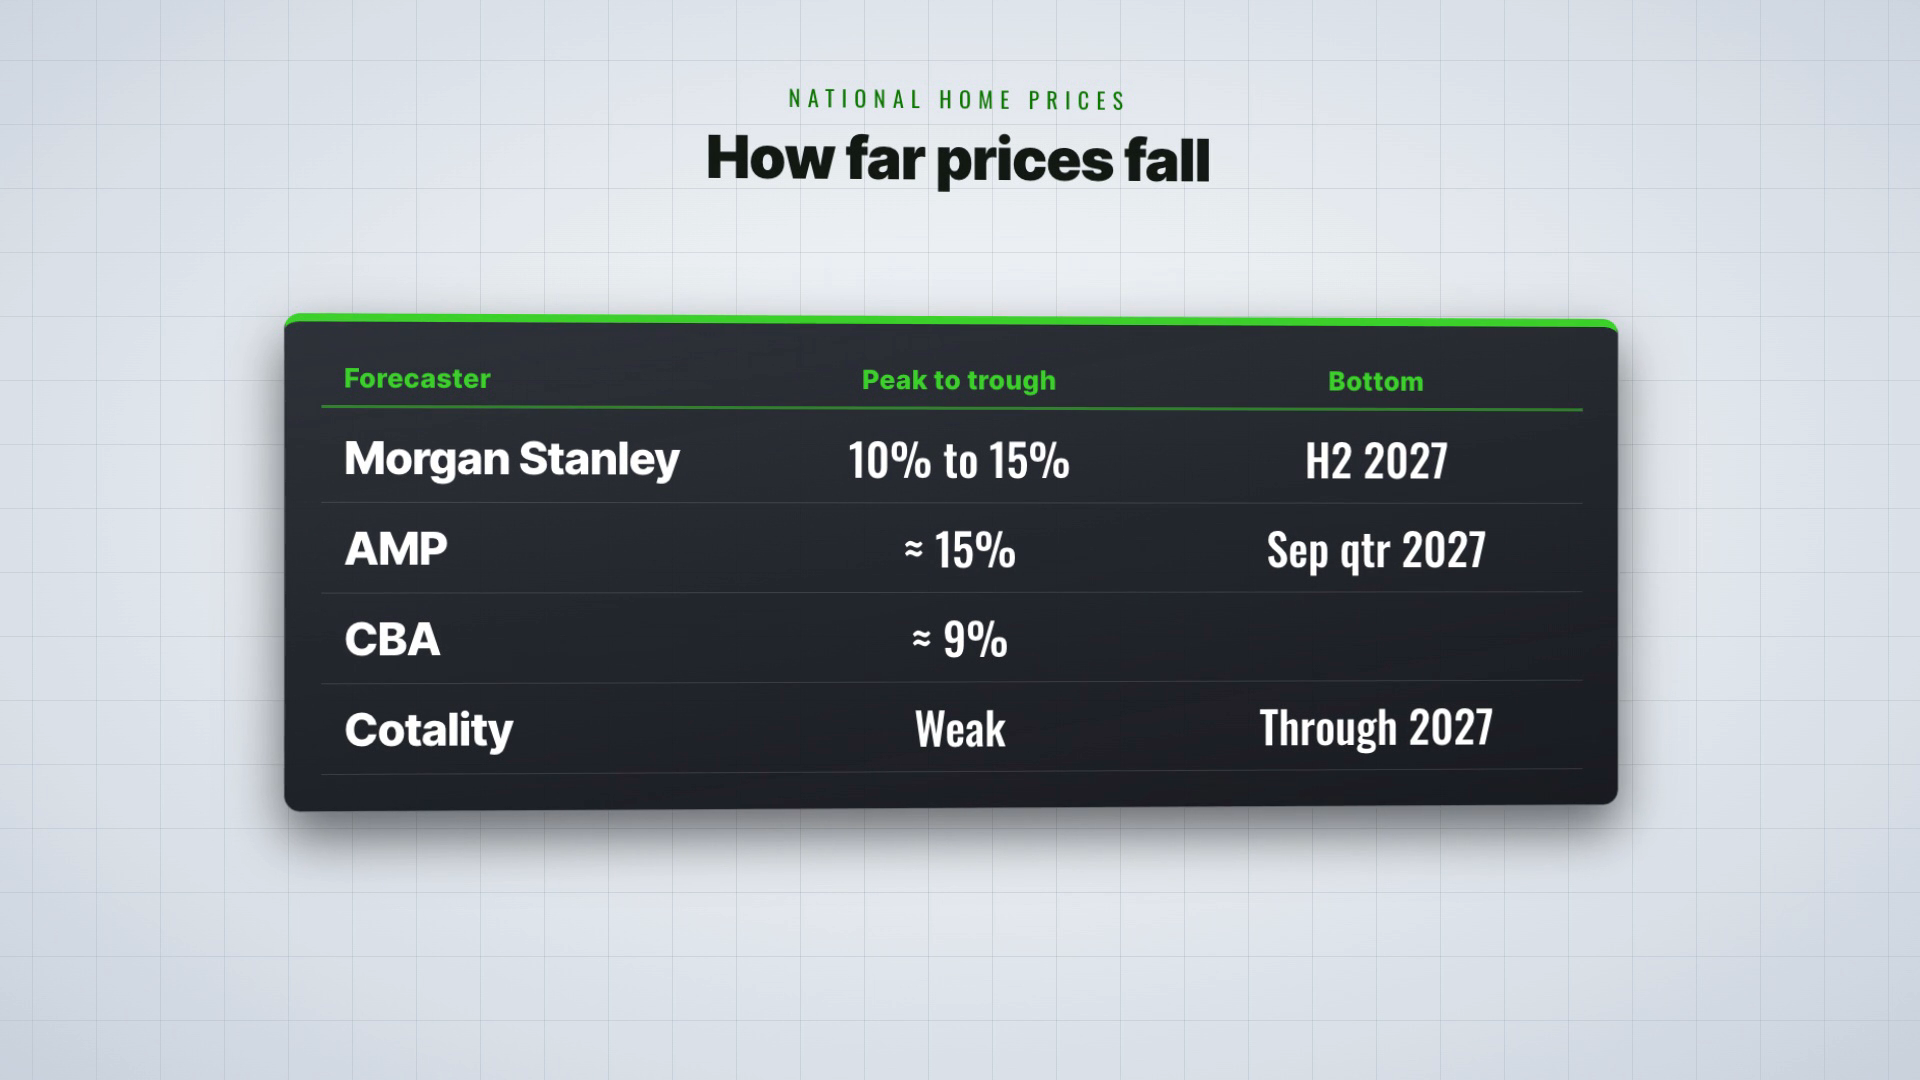
House price forecasts give a range, not an answer. Morgan Stanley expects national prices to fall 10% to 15% from peak to trough, bottoming out in the second half of 2027. AMP expects a fall of about 15%, CBA about 9%, and Cotality's view is that the market stays weak through 2027.
CBA called this an insurance hike, meaning it's better to move once more now than to chase inflation after it settles in. NAB said another hike in the coming months can't be ruled out, and Westpac said the risk of a February hike is rising. The RBA board voted 6 to 3. In September, its statement came with a line about further hikes if needed. This time, that line is gone, so the door to more hikes isn't closed, but the RBA has stopped saying more are coming.
October inflation, due on November 25th, matters most. September's figures forced this hike, and October's are the last inflation data the RBA will see before its December 8th decision.
Could these falls cause widespread negative equity, where a home is worth less than the loan? The RBA's Financial Stability Review says less than 1% of borrowers are in negative equity now, and even another 20% fall would only push that up to about 5% of mortgages. So this is a correction, and the banking system still has plenty of cushion. Morgan Stanley and AMP have both revised their forecasts down since July, so watch the direction more than the numbers.
Forecaster | Expected national fall, peak to trough | Timing |
Morgan Stanley | 10% to 15% (around 10% if the RBA stops hiking now) | Bottom in the second half of 2027 |
AMP | About 15% | Bottom around the September quarter of 2027 |
CBA | About 9% | No timing given |
Cotality | No percentage given | Market stays weak through 2027 |
Frequently Asked Questions
What is the cash rate after the latest RBA rate hike?
The cash rate is 4.85% after the RBA lifted it 0.25% on Melbourne Cup day. It was the fifth hike this year, after February, March, May and September, and the cash rate is now up 1.25% from 3.6% in January. That's the highest level since 2008.
How much do this year's rate hikes add to mortgage repayments?
On a $1 million mortgage, this year's five hikes add over $800 a month to your repayments. On an interest-only investment loan, it's over $1,000 a month. Banks also test new loans at your actual rate plus 3%, so on an average variable rate the test rate is now around 9.7%.
How much have Sydney house prices fallen?
Sydney fell 1.6% in October and is down 10.1% from its February peak, according to Cotality's October home value report. Values are now 1.5% below October 2021 levels, so anyone who bought there five years ago is back where they started. These are city-wide averages, and suburbs vary.
Why doesn't the inflation rate include house prices?
In the ABS inflation figures, housing covers rents, the cost of building new homes, and utilities like water and electricity. Existing home prices aren't counted at all. That's why housing was the biggest driver of inflation, up 5.2% over the year, even while home prices have been falling.
What happens to my LVR if my property's value falls?
Your loan-to-value ratio goes up. With an 80% interest-only loan, a 10% fall in value takes your loan to nearly 90% of what the property is worth. Above 80%, many banks will make you pay lenders mortgage insurance or won't take the loan on at all, so refinancing gets much harder.
When will Australian house prices stop falling?
Forecasts point to 2027. Morgan Stanley expects a 10% to 15% fall from peak to trough, bottoming out in the second half of 2027, and AMP sees the bottom around the September quarter of 2027. In my view, the answer isn't in the housing market. It's when rates actually peak.
What Will Decide When House Prices Stop Falling?
Prices are falling, rates are still rising, and this RBA rate hike makes it clear that inflation comes first. The answer to when prices stop falling isn't in the housing market. It's when rates actually peak. If you hold an investment property, recheck your cash flow this month at the bank's test rate. If you're getting ready to buy, don't just watch how far prices have fallen. Get your loan pre-approved before you put in an offer.
Recheck your cash flow at the bank's test rate
Get pre-approved before you make an offer
Check your LVR before you try to refinance
Allow for banks discounting overseas income
Watch October jobs data on November 19th
Watch October inflation on November 25th
Watch the RBA decision on December 8th
Book your free strategy call today.
Prefer to watch? See the full APS182 video on YouTube →
About the author
Alex is the founder of AusPropertyStrategy, a Sydney-based licensed buyer's agent and property investment strategist with dual master's degrees in accounting and an MBA, and a former general manager of a listed company. For APS182, he worked through Cotality's October home value report, the RBA's latest decision and statement, the ABS inflation and jobs figures, the RBA's Financial Stability Review and the major banks' forecasts.
What we tested: what this year's hikes add to repayments on a $1 million mortgage; the bank's test rate on an average 6.7% variable rate with the 3% buffer; what a 10% fall does to an 80% interest-only loan; and how far the current downturn has run compared with 2017 to 2019 and 2022 to 2023.
About the figures: house price and market activity figures are from Cotality's October home value report, released on November 2nd. Bank and economist figures are forecasts, and forecasts are only forecasts. Repayment, test rate and LVR figures are worked examples, not anyone's actual loan. This is general information, not financial advice.


