

Australia's Mid-Sized Capitals Are Falling Fast: Sydney 2017 or Perth 2014?
Last updated: 2026-11-11
🔑 Key Takeaways (TL;DR)
Brisbane fell 2% and Perth 1.7% in October, the two biggest falls in the country.
On three of the four factors, this fall looks more like Sydney in 2017 than Perth after 2014.
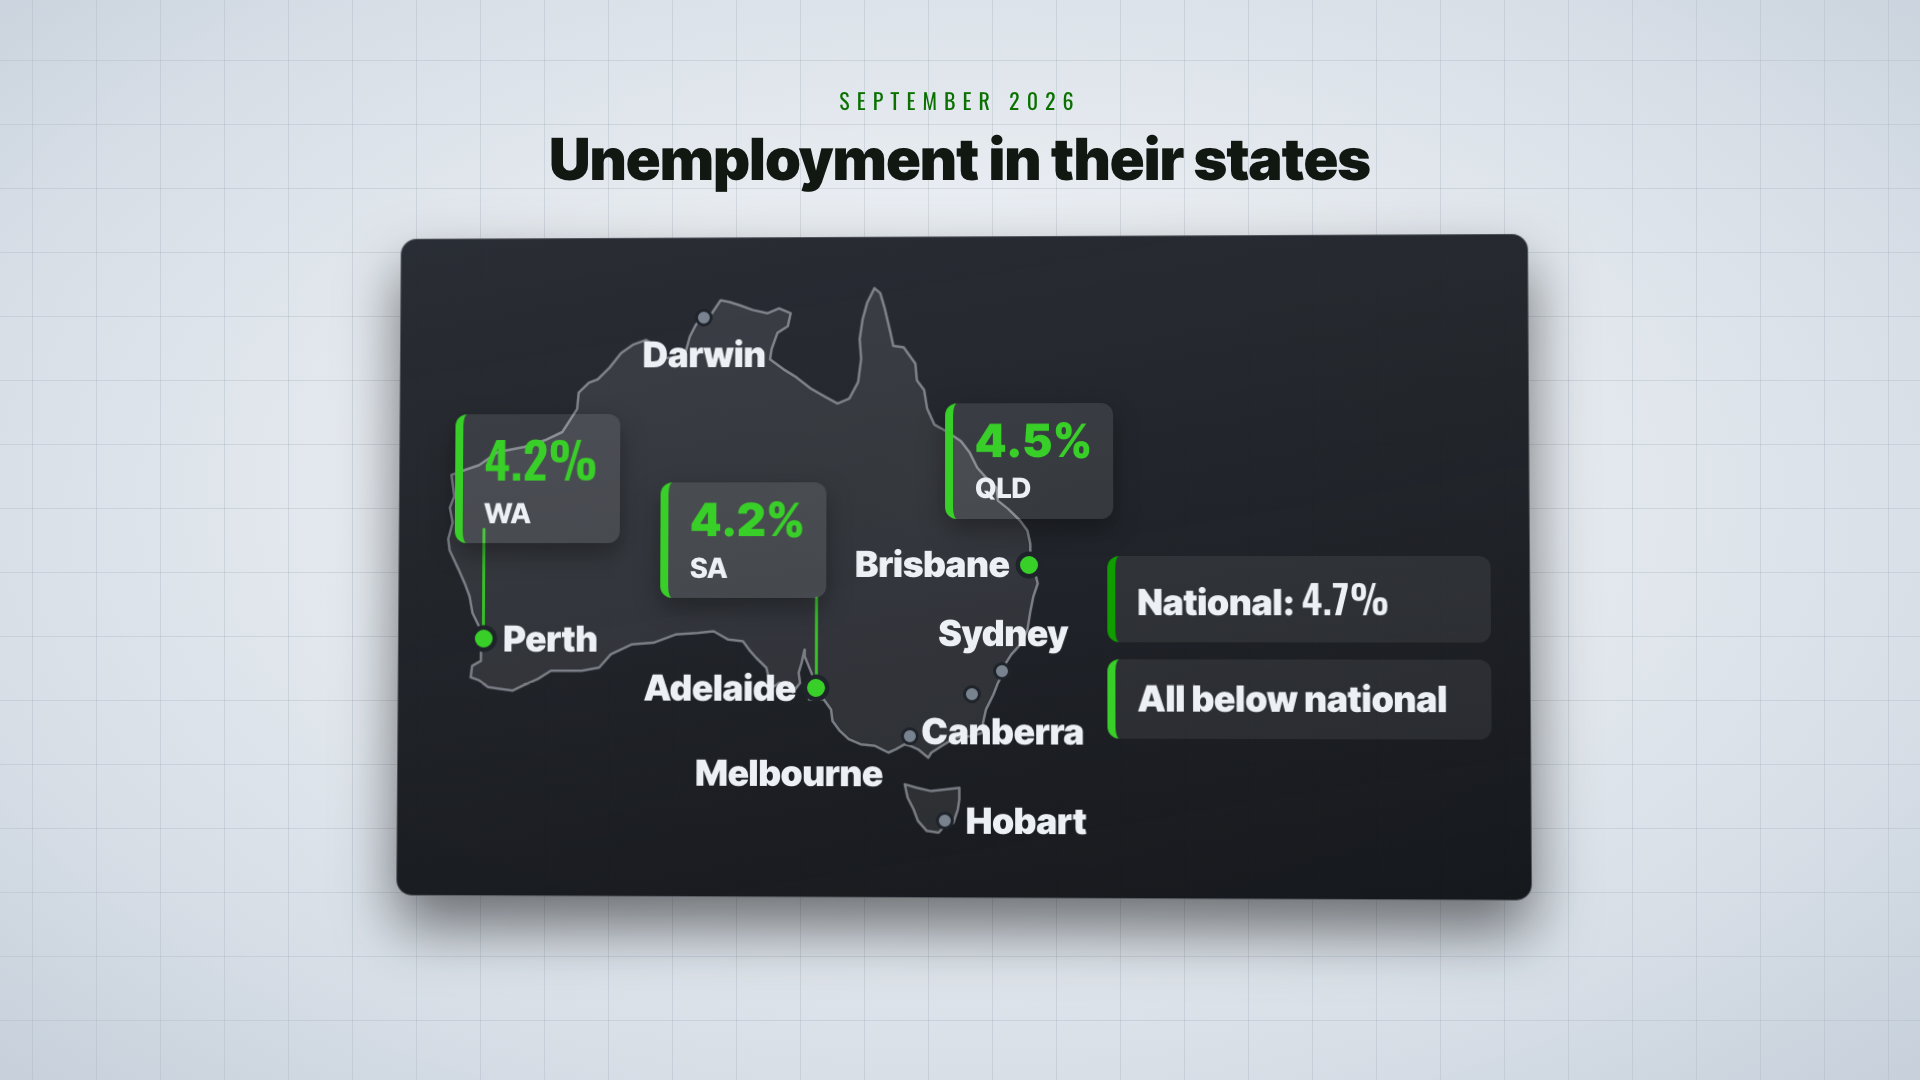
Unemployment is 4.2% in WA and South Australia and 4.5% in Queensland, all below the national 4.7%.
None of the four turnaround conditions, from rate cuts to migration, has shown up yet.
Contents
Which Cities Are Leading Australia's Property Downturn?
What Separates a Sydney-Style Fall From a Perth-Style Fall?
Is This Property Downturn Coming From Credit or From the City?
Why Did Perth's Property Downturn After 2014 Last So Long?
Are Jobs and Population Holding Up in Brisbane, Perth and Adelaide?
Who Is Selling in the Mid-Sized Capitals Now?
What Turned Sydney and Perth Prices Around?
Have the Turnaround Conditions Shown Up This Time?
What Should Owners in Brisbane, Perth and Adelaide Watch Next?
Frequently Asked Questions
Is This Fall More Like Sydney in 2017 or Perth After 2014?
Australia's property downturn is now led by the mid-sized capitals that rose the most. Prices have fallen in almost every suburb of Brisbane, Perth and Adelaide over the last three months, and owners there have been nervous. The big fear is a repeat of Perth after 2014, when the RBA kept cutting rates and prices still fell for over five years.
Sydney fell in that period too, but once policy changed and rates came down, it turned around quickly. I've gone through decades of downturn data for these three cities to answer two questions. Why did rate cuts bring Sydney back but not Perth? And which kind of fall is your property facing? This article is based on my latest AusPropertyStrategy episode. Watch the full APS183 video on YouTube →
Mark and Sarah below are hypothetical owners, and this is general information, not financial advice.
Which Cities Are Leading Australia's Property Downturn?
Brisbane and Perth are leading Australia's property downturn. In the October figures that property data firm Cotality released on 2 November, Brisbane fell 2% and Perth fell 1.7%, the two biggest falls in the country, with Sydney third at 1.6%. Prices have fallen in almost every suburb of Brisbane, Perth and Adelaide over three months.
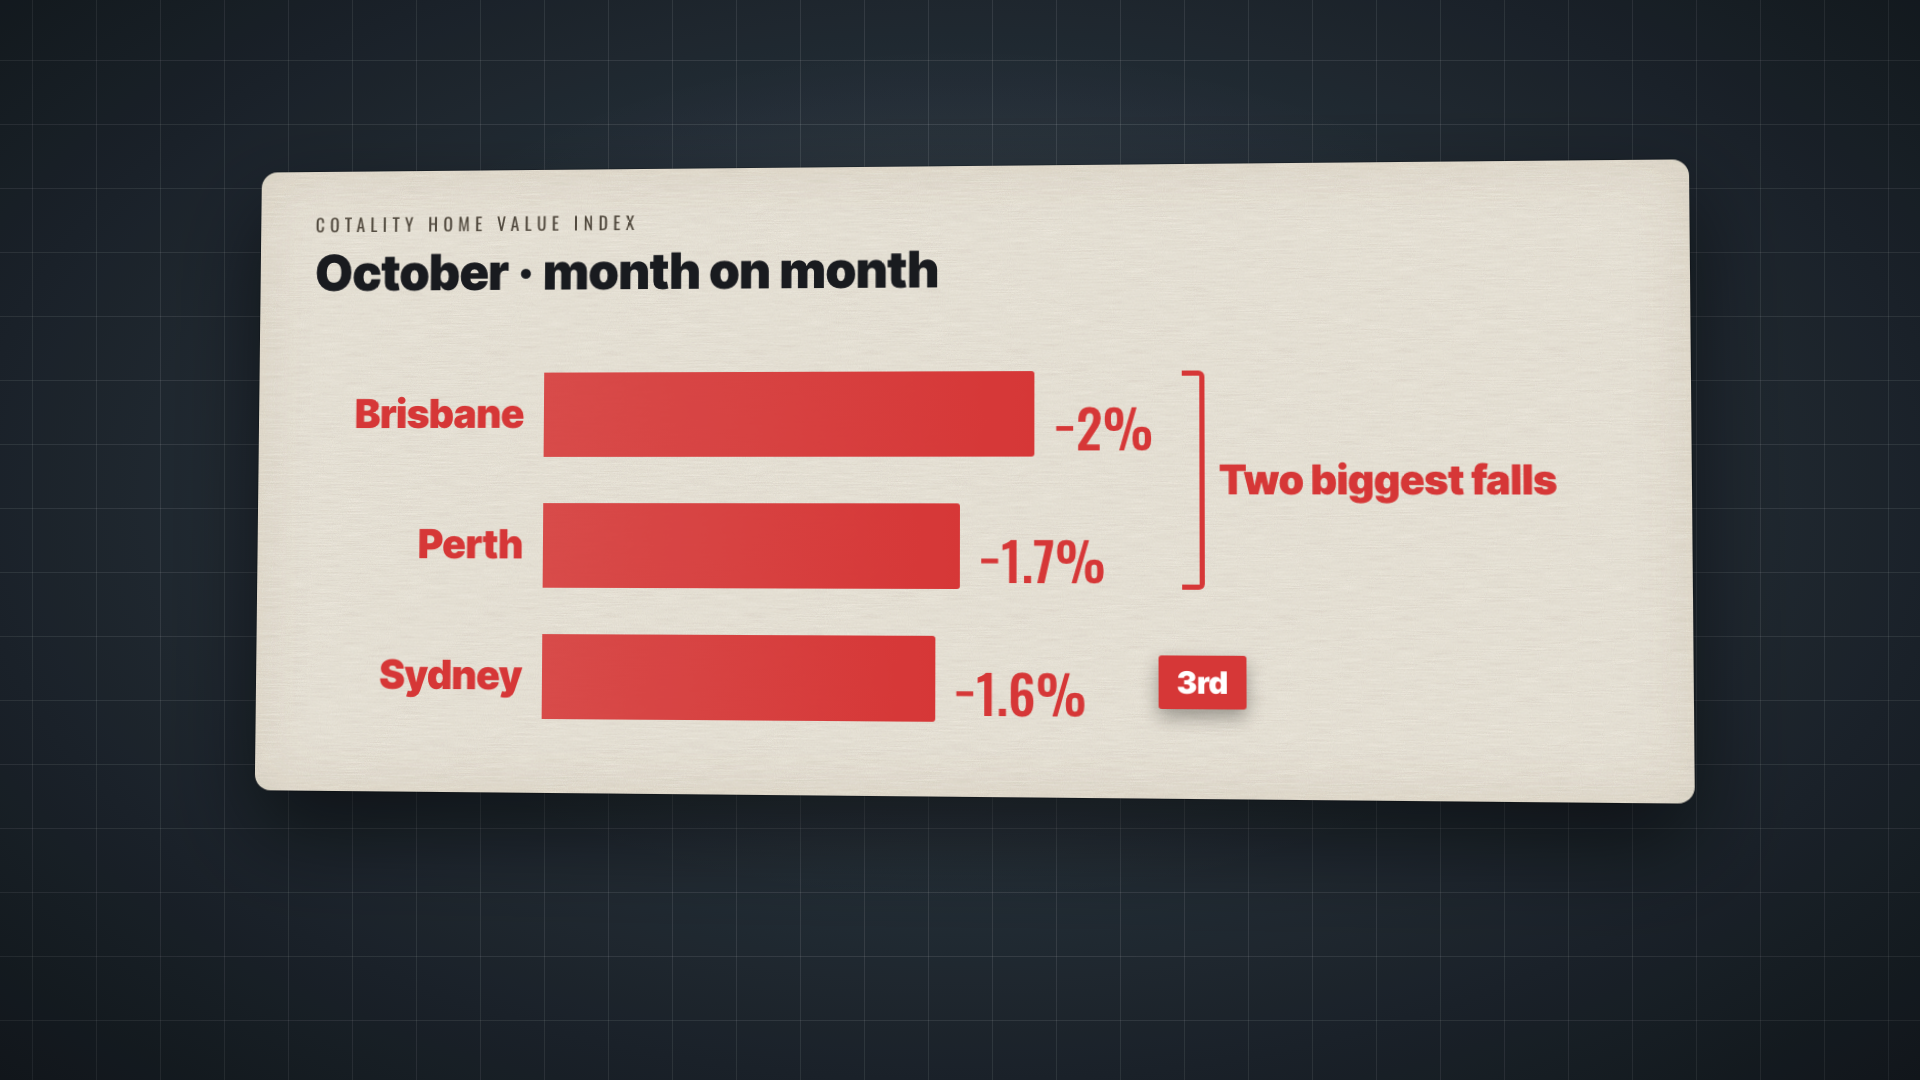
These are the cities that rose the most. Over five years, Perth is up almost 70%, Adelaide more than 50% and Brisbane more than 40%, while Sydney has gone slightly backwards. So Brisbane and Perth rose strongly, and now they're falling faster than Sydney.
Why are the mid-sized capitals leading this property downturn? They rose the most over five years, so they were the first to get too expensive for buyers. In 2017, Sydney buyers held back because of regulation. This time it's interest rates and tax, but in both cases the pressure shows up in credit.
The October figures make the pattern plain. Brisbane and Perth rose strongly over five years and are now falling faster than Sydney, which went slightly backwards over the same period.
To tell which kind of fall this is, I score it against Sydney and Perth on four factors: the cause, jobs and population, who's selling, and whether the turnaround conditions have shown up. The first factor is the cause. Is this fall coming from credit, or from the city itself?
City | October fall (Cotality) | Five-year change |
Brisbane | 2%, the biggest in the country | Up more than 40% |
Perth | 1.7%, the second biggest | Up almost 70% |
Sydney | 1.6%, the third biggest | Slightly backwards |
Adelaide | Prices down in almost every suburb over three months | Up more than 50% |
What Separates a Sydney-Style Fall From a Perth-Style Fall?
Australia's past property downturns come in two types. In a Sydney-style fall, credit gets squeezed and prices fall fast, then rise back above the previous peak once rates drop and banks loosen lending. In a Perth-style fall, the city's jobs and population shrink, prices fall slowly, and rate cuts can't lift them.
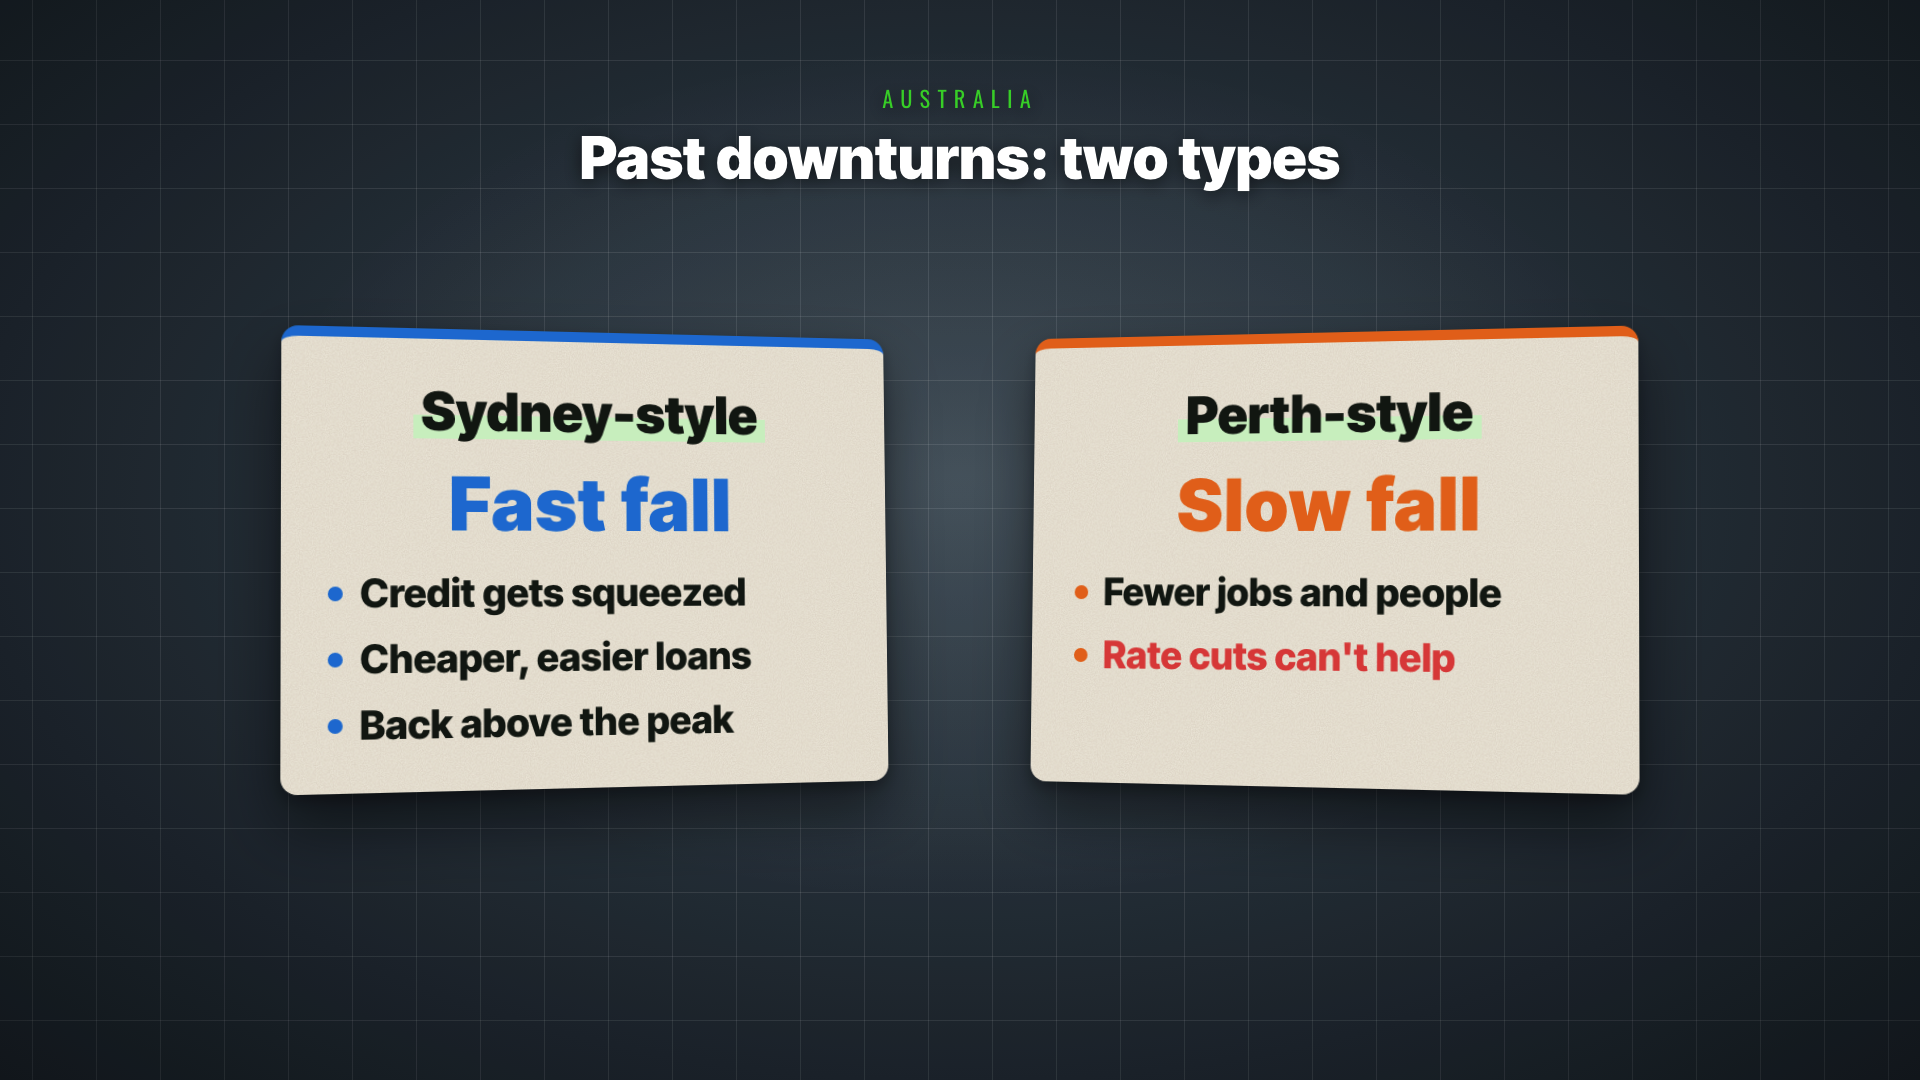
Sydney fell about 15% over 22 months, from July 2017 to May 2019, because borrowing got harder. Cotality's research found the economy and population were still in decent shape, so the fall came mainly from tighter credit. Perth was different: after 2014, the mining boom wound down and incomes across the city fell.
In Sydney, regulators and banks kept tightening, so the same salary got you a smaller loan. Fewer people put in offers, and the offers that did come in were lower. That's a credit problem, and it hits prices quickly.
Perth's fall had a different starting point. After 2014, China had too much steel capacity, iron ore demand dropped off, and Western Australia's mining boom wound down. The mines, and the engineering, transport and services businesses around them, needed fewer workers. That was the city itself running into trouble.
The type of fall depends on its cause, not the city. Perth fell about 11% in 13 months from 2008 to 2009, when banks worldwide were tightening lending and WA's mines were still busy, so that fall came from credit. In 2010 and 2011, it fell about 9% over 19 months. The way I see it, a fall caused by harder borrowing is fast in any city, while a fall caused by lost jobs and people leaving is slow anywhere.
Feature | Sydney-style fall | Perth-style fall |
What causes it | Credit gets squeezed | The city's jobs and population shrink |
How prices fall | Fast | Slowly, for a long time |
What rate cuts do | With easier lending, prices rise back above the previous peak | Can't lift prices on their own |
Example | Sydney, July 2017 to May 2019: about 15% over 22 months | Perth, June 2014 to September 2019: about 20% over 63 months |
Is This Property Downturn Coming From Credit or From the City?
This property downturn is coming from credit. The ABC's reporting calls it a demand-side fall, and says federal cuts to tax breaks like negative gearing have weakened investor demand. People still want to buy, but fewer can borrow enough or are willing to commit.
The RBA's hikes all through 2026 have tightened the bank's test of what you can repay, so on the same salary, you now get approved for less. That's a squeeze on credit, not a city losing its jobs, so on the first factor this fall looks like Sydney in 2017.
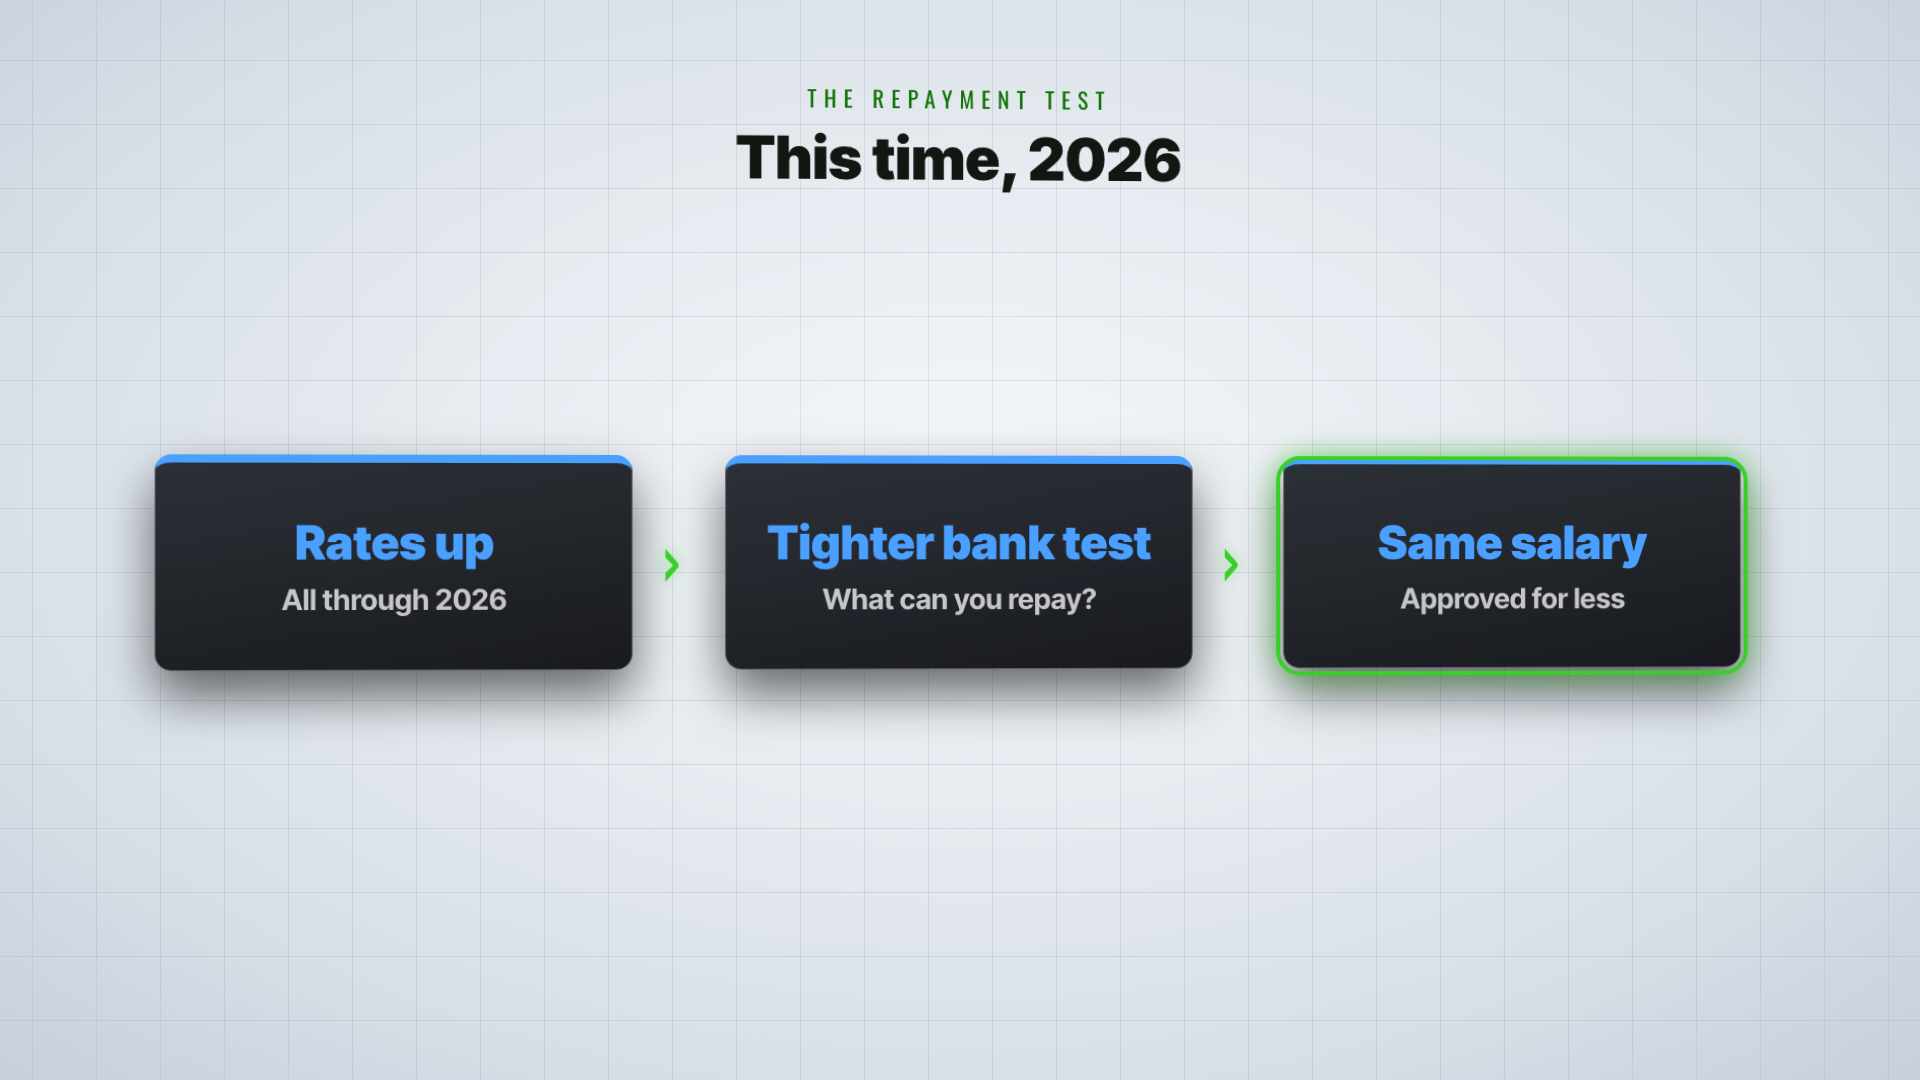
My first thought was Perth all over again, but once I lined up the two causes, they looked different. Two hypothetical owners show the gap between them.
Mark bought at the Perth peak in 2014. Prices fell until 2019 because Perth itself was losing jobs, which makes his a Perth-style fall. Sarah bought in Brisbane in 2023. Prices there have fallen for the last three months because rising rates mean buyers can't borrow as much, and there are fewer investors since the tax changes. That's a credit problem, which makes hers a Sydney-style fall.
A Sydney-style cause doesn't guarantee a Sydney-style outcome, though. The second factor is whether jobs and population in these cities are falling, and that is exactly what turned Perth's fall after 2014 into a five-year decline.
Owner (hypothetical) | What happened | Type of fall |
Mark | Bought at the Perth peak in 2014; prices fell until 2019 as Perth lost jobs | Perth-style |
Sarah | Bought in Brisbane in 2023; prices fell for three months as buyers could borrow less and investors pulled back | Sydney-style |
Why Did Perth's Property Downturn After 2014 Last So Long?
Perth prices peaked in June 2014 and bottomed out in September 2019, down about 20% over 63 months. They didn't regain that level until April 2022, 94 months, or almost eight years, after the peak. The cause was jobs: Western Australia's unemployment rate rose to about 7% by March 2018.
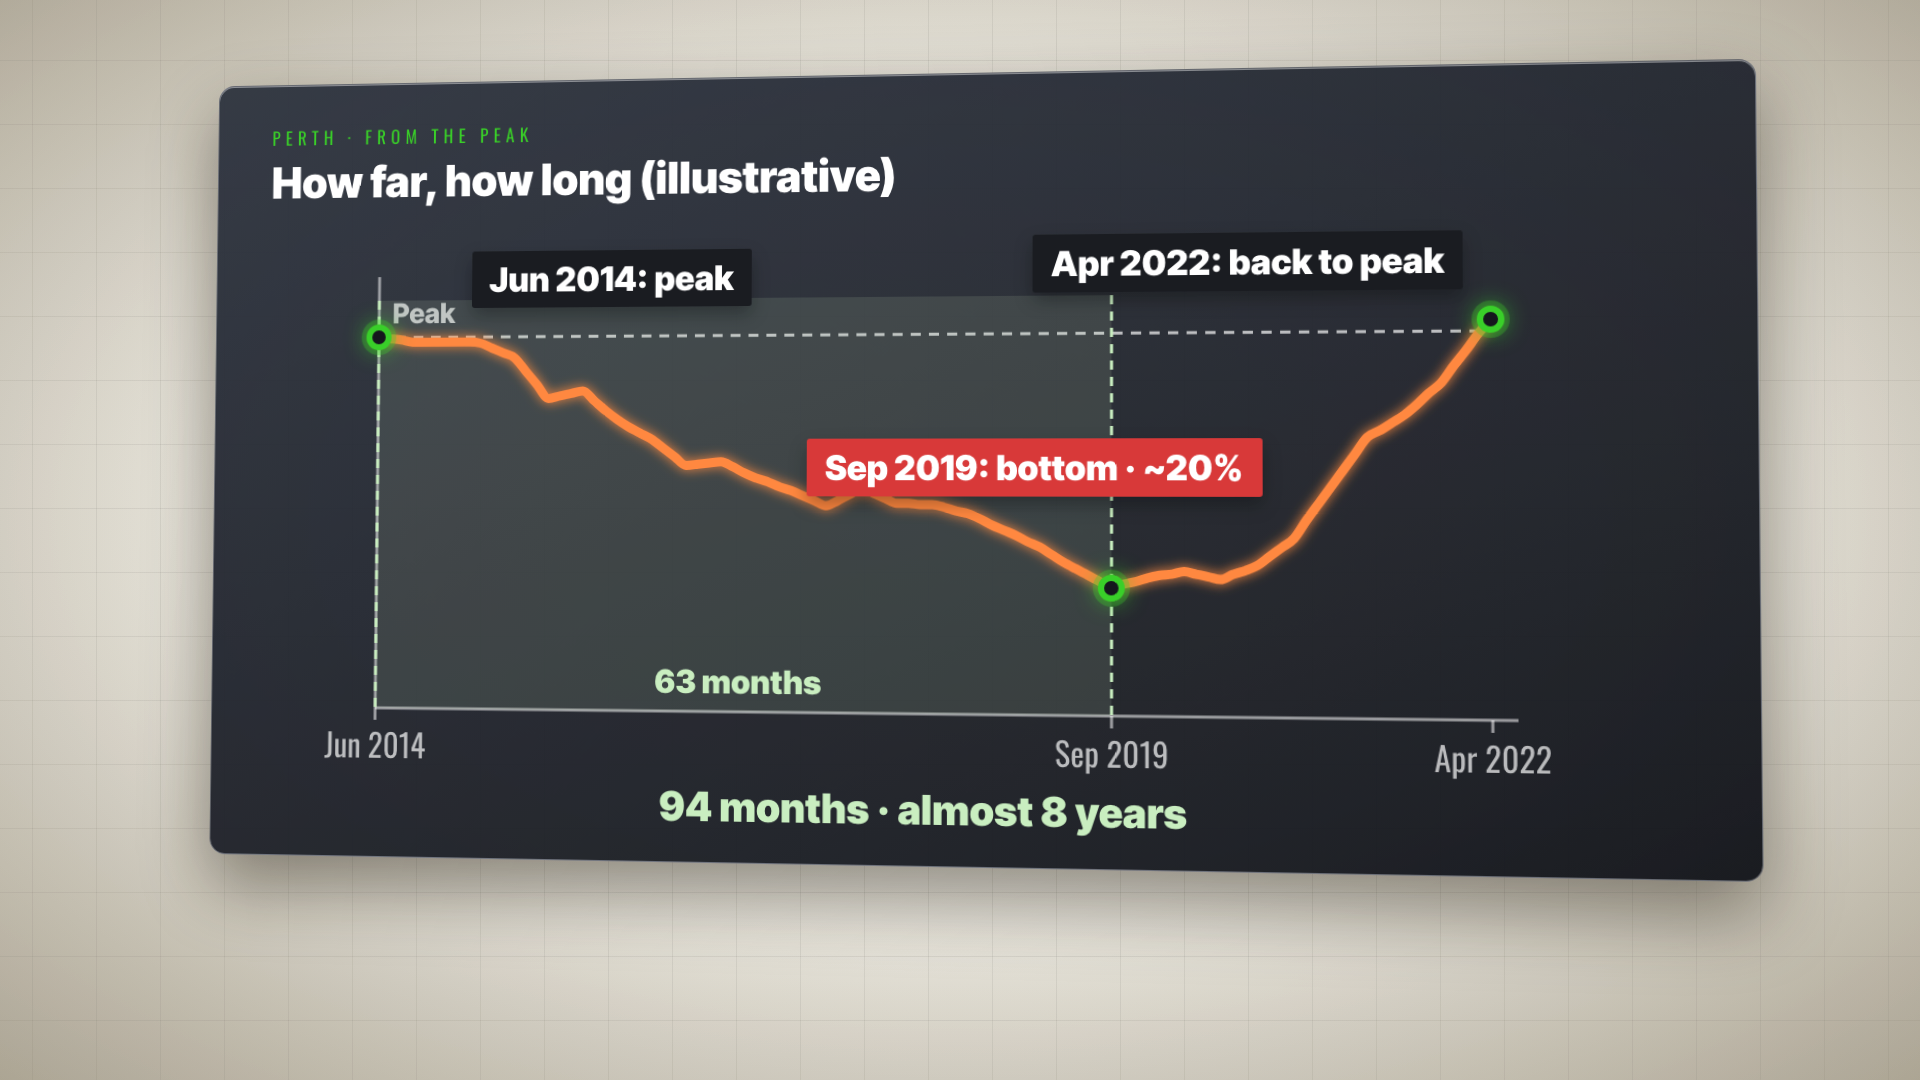
Population growth fell away as well. At the peak of the mining boom, WA added almost 80,000 people a year, but by 2017 that was down to just over 20,000, with more people leaving for other states than arriving. Darwin fell even further, more than 30% in almost six years.
People who'd lost their jobs had to sell, and people moving interstate had to sell. There were fewer buyers every year, so prices fell slowly, for a long time.
Rate cuts didn't fix it. In 2015 and 2016, the RBA cut the cash rate four times, from 2.5% to 1.5%, and mortgage rates usually follow it. Perth kept falling anyway. A rate cut lowers the interest borrowers pay, but it doesn't help someone who's lost their job. Without a job, nobody borrows to buy, however low rates go, and owners with no income still have to sell.
Here's what that meant for Mark. His $600,000 home was worth about $480,000 at the 2019 bottom. It only got back to $600,000 in 2022, and that's before counting almost eight years of interest, land tax and strata fees.
Downturn | Fall | How long it lasted |
Perth, 2008 to 2009 | About 11% | 13 months |
Perth, 2010 to 2011 | About 9% | 19 months |
Perth, June 2014 to September 2019 | About 20% | 63 months, and 94 months to regain the peak |
Darwin, May 2014 to early 2020 | More than 30% | Almost six years |
📌 Thinking about your own situation?
Book a free 15-minute call with one of our property investment strategists and get a straight answer, no strings. For the full done-for-you path, from strategy, lending and property selection to portfolio, tax structure and wealth planning, book a free 30-minute Discovery Session and see how VISION Gold Membership works.
Are Jobs and Population Holding Up in Brisbane, Perth and Adelaide?
Jobs and population are holding up for now. WA's unemployment rate was 4.2% in September 2026, below the national rate of 4.7% and almost 3% below its 2018 peak. South Australia was also at 4.2%, and Queensland at 4.5%. On jobs alone, this isn't Perth after 2014.
Population is growing too. In the year to March 2026, population grew 1% in South Australia, 1.6% in Queensland and 2.1% in WA, the fastest in the country. None of these cities is showing what Perth showed after 2014, with unemployment rising and people leaving.
On the second factor, then, they look more like Sydney in 2017. That's only today, though. The RBA's November forecast has national unemployment rising gradually to 5.1% over two years, so this factor needs watching.
So if Perth is one of the fastest-falling cities right now, why doesn't this property downturn look like Perth after 2014? Because the type of fall depends on its cause, not the city. A fall caused by harder borrowing recovers fairly quickly once policy loosens. A fall caused by lost jobs and people leaving lasts a long time. Jobs and population are holding up, yet homes still aren't selling easily, which brings us to the sellers.
State | Unemployment rate | Population growth, year to March 2026 |
Western Australia | 4.2% in September 2026, down from about 7% in March 2018 | 2.1%, the fastest in the country |
Queensland | 4.5% in September 2026 | 1.6% |
South Australia | 4.2% in September 2026 | 1% |
Who Is Selling in the Mid-Sized Capitals Now?
In this property downturn, owners who can afford their mortgage aren't rushing to sell. Across the capital cities, October 2026 new listings were almost 20% below average for the month, yet unsold stock was the highest for October since 2019. Fewer new sellers and slower sales point to Sydney in 2017, not Perth after 2014.
Brisbane shows this most clearly. Unsold stock there started 2026 well below the five-year average. By late October, Cotality's figures put it almost a quarter above average, while new listings were about 17% below. That gives buyers more room to negotiate.
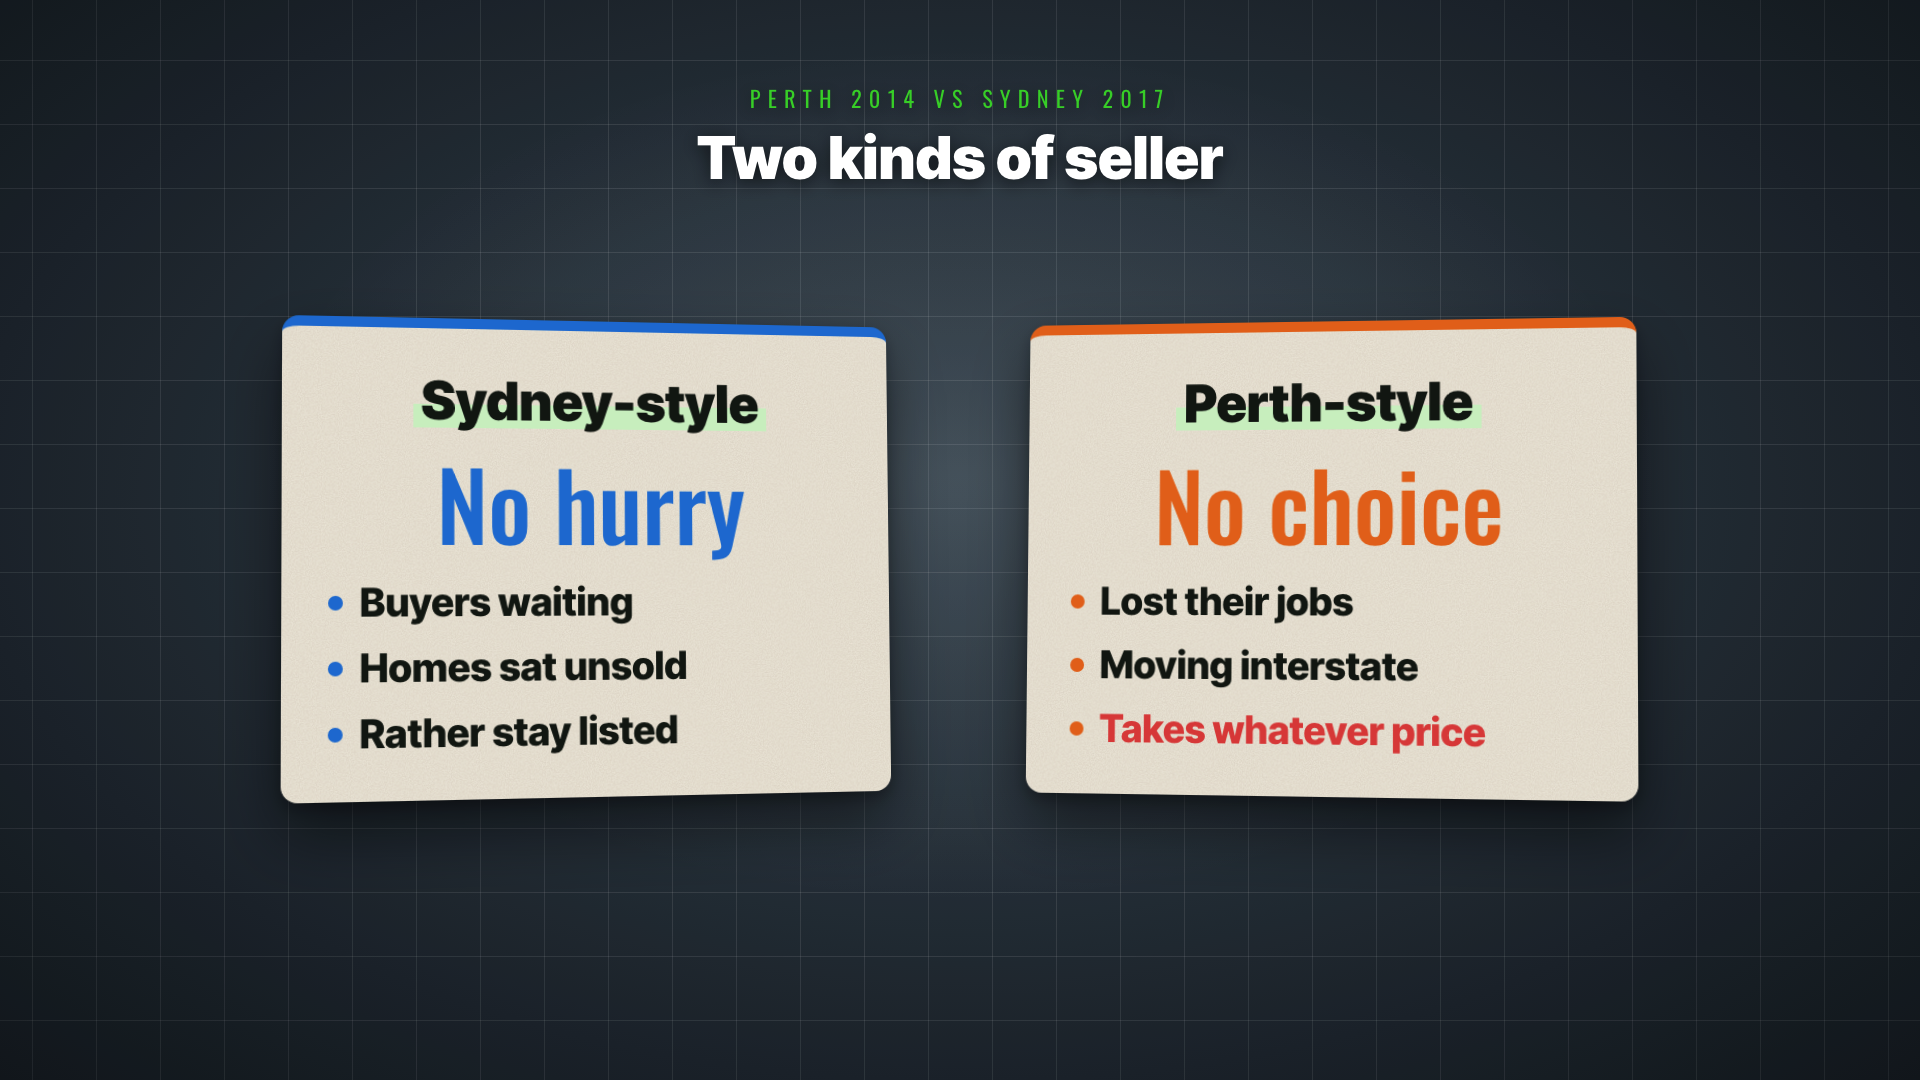
Who's selling matters because a forced seller takes whatever price they can get, while a seller in no hurry would rather stay listed than cut the price. In Perth after 2014, many sellers had lost their jobs and were moving interstate, so they had no choice. In Sydney in 2017, buyers were waiting, sellers weren't in a hurry, and homes sat unsold.
If owners were rushing to sell now, new listings would have jumped. They haven't. These three cities rose so much that most people who bought a few years back are still ahead on paper, even after a big fall.
Around Sarah's Brisbane property, fewer homes are being listed, earlier listings haven't sold, and open homes are getting quieter. When should you worry? A sudden jump in new listings while unemployment rises would mean forced selling. We haven't seen both together yet, so on the third factor, sellers aren't panicking.
Market | Who was selling | What it did to prices |
Perth after 2014 | Owners who'd lost jobs or were moving interstate | Forced sellers took whatever price they could get |
Sydney in 2017 | Sellers in no hurry, with buyers waiting | Homes sat unsold |
Capital cities, October 2026 | New listings almost 20% below average | Unsold stock highest for October since 2019 |
Brisbane, late October 2026 | New listings about 17% below average | Unsold stock almost a quarter above average |
What Turned Sydney and Perth Prices Around?
Sydney turned around in 2019 because three things made borrowing easier. After the May federal election, the plan to tighten negative gearing was dropped. The RBA cut rates in June, July and October, bringing the cash rate down to 0.75%. In early July, APRA scrapped the 7% floor in loan assessments.
Sydney prices bottomed out in May 2019, the month of the election, and rose as those three changes took effect. Banks had been testing whether you could repay at 7%, whatever your actual rate, so once that floor went, people on the same salary could borrow a lot more.
In 2023, after a national fall, prices rose again even though the RBA was still hiking. That recovery didn't need rate cuts, because a shortage of homes for sale, a tight rental market and a big wave of migration suddenly meant many more people wanted to buy or rent.
Perth after 2014 was different, because rate cuts alone didn't lift prices. Prices only turned around once mining recovered: WA's unemployment fell below 4%, and from the second half of 2020, people started moving to WA from other states. The RBA also cut rates to 0.1% during COVID in 2020. Perth needed the jobs back first, and only then could rate cuts work.
A Sydney-style recovery needs rate cuts, easier lending and policy that stops tightening, and 2023 added a fourth condition: strong migration. A Perth-style recovery needs the mining jobs back.
Have the Turnaround Conditions Shown Up This Time?
None of the four turnaround conditions has shown up yet. On 3 November, the RBA hiked for the fifth time in 2026, pushing the cash rate up to 4.85%, the highest since late 2008. Three of the nine board members wanted to hold rates, and there still hasn't been a cut.
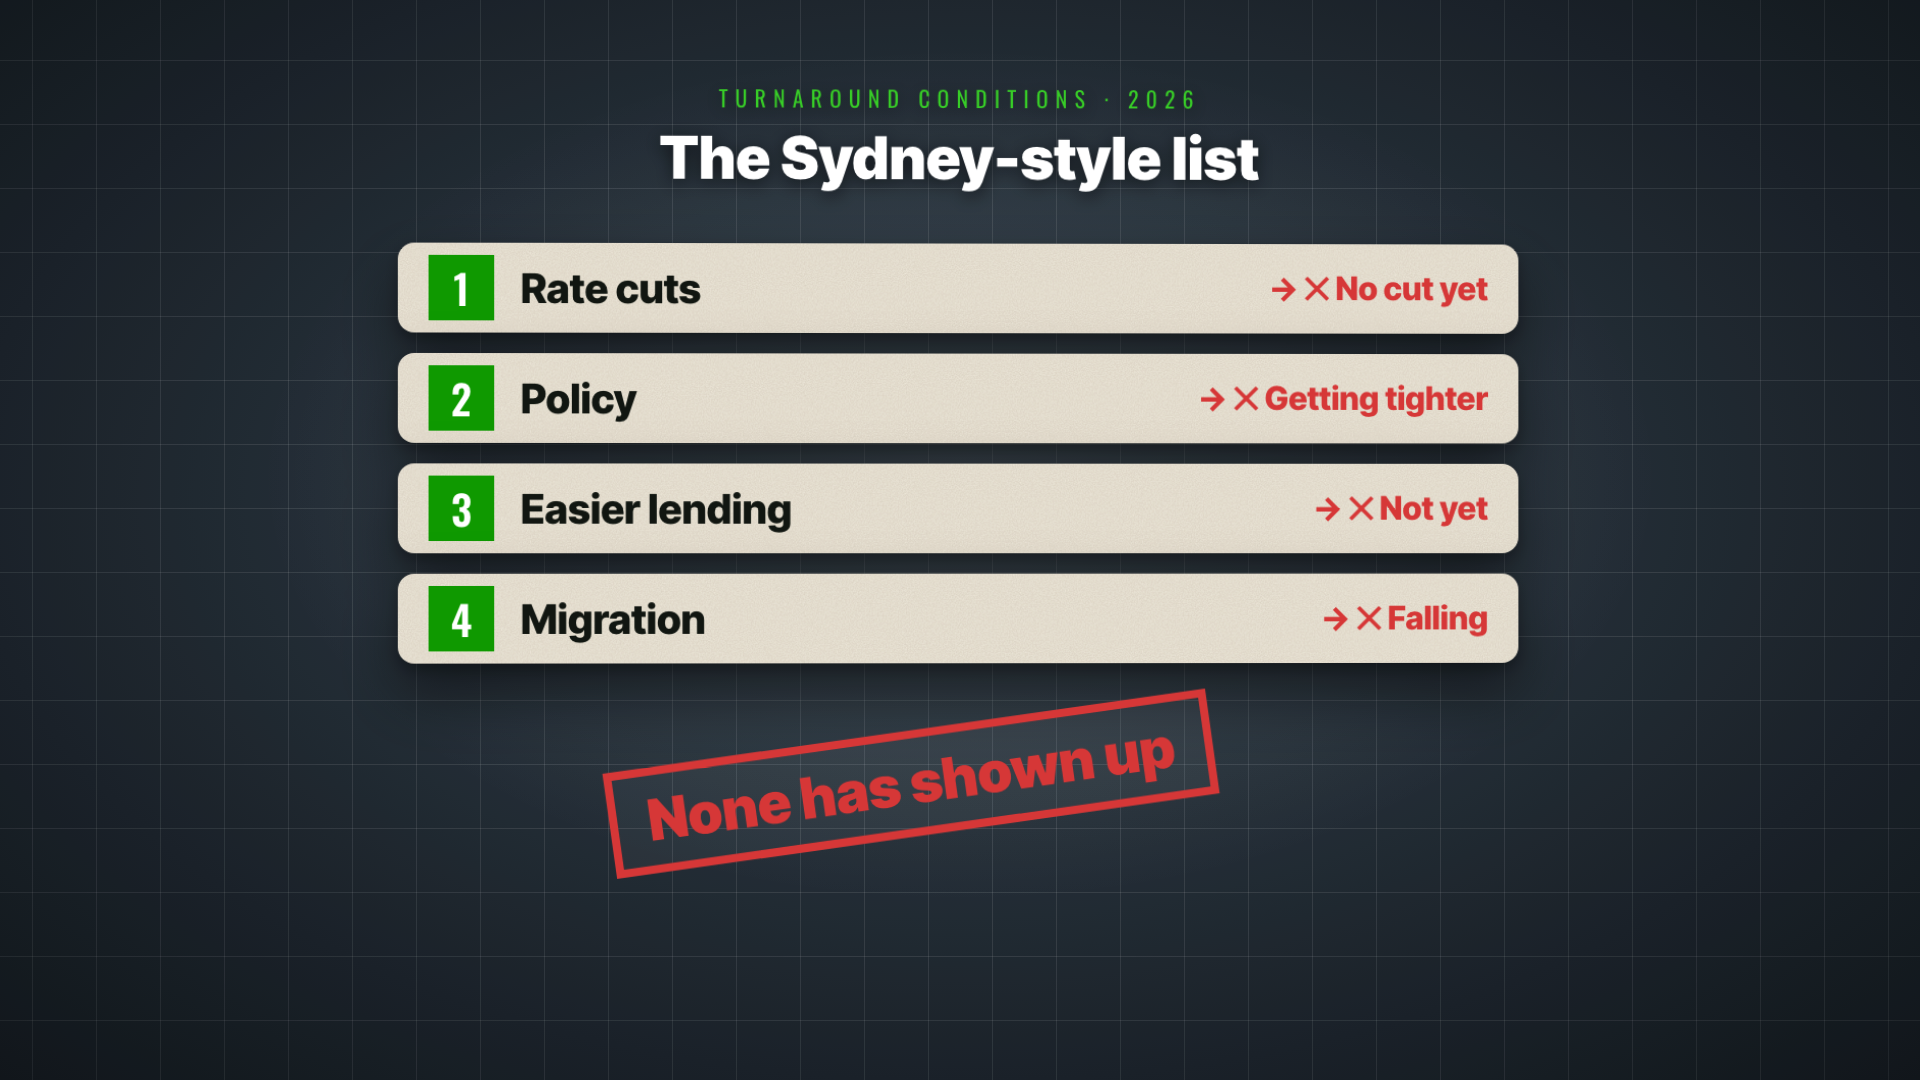
Policy in 2026 is the opposite of 2019. The negative gearing and capital gains tax reforms were legislated in June and take effect on 1 July 2027. Capital gains tax is the tax on your profit when you sell an investment property. The guessing is over, and the rules are getting tighter.
Lending hasn't eased in this property downturn either, and so far I haven't seen APRA loosen loan assessments the way it did in 2019. Migration is the last condition. Net overseas migration, arrivals minus departures, was more than 500,000 people in 2023. In the year to March 2026, it was about 290,000, a bit lower than the year before and just over half the 2023 level.
So how do we score the fourth factor? My call is that it looks like neither. It isn't Perth after 2014, because jobs and population are holding up, and it isn't Sydney in 2017, because those turnaround conditions haven't arrived. For now, it gets a question mark.
I'm not saying prices in these three cities are safe. While jobs and population hold up, a five-year decline like Perth after 2014 is less likely. But these cities rose a lot, so there's more room for prices to come back down too.
Turnaround condition | Sydney 2019 (migration: 2023) | Now |
Rate cuts | Cut in June, July and October 2019, to 0.75% | Fifth hike of 2026 on 3 November, to 4.85% |
Easier lending | APRA scrapped the 7% floor in early July 2019 | No APRA loosening so far |
Policy stops tightening | Negative gearing plan dropped after the May 2019 election | Negative gearing and CGT reforms start on 1 July 2027 |
Strong migration | More than 500,000 in 2023 | About 290,000 in the year to March 2026 |
What Should Owners in Brisbane, Perth and Adelaide Watch Next?
Watch two sets of signals. The first tells you whether jobs and population are holding up: your state's unemployment rate, which the Australian Bureau of Statistics releases mid-month, and quarterly state population and interstate migration figures. The second tells you whether the turnaround conditions are showing up.
Unemployment comes first because mortgages are paid out of wages, so people who keep their jobs aren't forced to sell. Also watch local rents and vacancy rates. It's only when these indicators turn the wrong way that the city itself is in trouble.
For the turnaround conditions, read the RBA's statement after each rate decision. The November statement only said the board would watch the data and do what's needed, without saying more hikes were coming. Watch whether the next few statements lean towards cuts, and go by what the RBA says rather than guessing.
Check Cotality's city figures on the first working day of each month, to see whether the monthly falls are shrinking or growing. One month means little, so look for several months moving the same way. For lending, watch for news of APRA loosening loan assessments. For migration, check the quarterly ABS population data.
If you own property in a mid-sized capital, start by plotting your state's unemployment rate and population growth since the start of 2026. Then look up homes like yours in your suburb on the major listing sites, and check how long they've been listed, whether prices have been cut, and whether they've been withdrawn.
Signal | When to check | What it tells you |
State unemployment rate | Mid-month, from the ABS | Whether owners keep the wages that pay their mortgages |
State population and interstate migration | Every quarter | Whether people are arriving or leaving |
Local rents and vacancy rates | Alongside the jobs figures | Whether local demand is holding |
RBA statement | After each rate decision | Whether the board is leaning towards cuts |
Cotality city figures | First working day of each month | Whether monthly falls are shrinking or growing |
APRA lending rules | When announced | Whether loan assessments are loosening |
Frequently Asked Questions
How far did Perth house prices fall after 2014?
About 20% over 63 months. Perth prices peaked in June 2014 and bottomed out in September 2019, and they didn't regain that level until April 2022, almost eight years after the peak. On a hypothetical $600,000 home, that's a fall to about $480,000 before carrying costs.
Why didn't rate cuts stop Perth's fall after 2014?
Perth's problem was jobs, not credit. The RBA cut the cash rate four times in 2015 and 2016, from 2.5% to 1.5%, but WA unemployment rose to about 7% by March 2018. A rate cut lowers what borrowers pay, but it doesn't help someone who has lost their job.
Why are Brisbane and Perth house prices falling faster than Sydney?
Brisbane and Perth are among the mid-sized capitals that rose the most, so they were the first to get too expensive for buyers. Over five years, Perth is up almost 70% and Brisbane more than 40%, while Sydney has gone slightly backwards. In October, Brisbane fell 2% and Perth 1.7%.
Are sellers panicking in Brisbane?
Not yet. By late October, Cotality's figures put Brisbane's unsold stock almost a quarter above average, but new listings were about 17% below average. Owners who can afford their mortgage are holding on. Forced selling would show up as a sudden jump in new listings while unemployment rises.
When do the negative gearing and capital gains tax changes start?
The reforms were legislated in June 2026 and take effect on 1 July 2027. Capital gains tax is the tax on your profit when you sell an investment property. Unlike 2019, when the plan to tighten negative gearing was dropped after the election, policy is now getting tighter.
How much has net overseas migration fallen?
Net overseas migration, arrivals minus departures, was more than 500,000 people in 2023. In the year to March 2026, it was about 290,000, a bit lower than the year before and just over half the 2023 level. Strong migration helped prices rise in 2023 while the RBA was still hiking.
Is This Fall More Like Sydney in 2017 or Perth After 2014?
My take is that this property downturn looks more like Sydney's in 2017. The cause is credit, jobs and population are holding up, and sellers aren't panicking. As long as jobs and population in Brisbane, Perth and Adelaide hold up, it won't become a five-year decline like Perth's after 2014. But not one of the four turnaround conditions, from rate cuts to migration, has shown up yet. Track the signals that would change that score, starting with your state's unemployment rate. If things move the right way, you can rest easier. If they turn bad, you'll know before most people.
Plot your state's unemployment rate since 2026
Track state population and interstate migration
Check local rents and vacancy rates
Read the RBA statement after each decision
Check Cotality's city figures each month
Watch for APRA loosening loan assessments
See how long homes like yours stay listed
Book your free strategy call today.
Prefer to watch? See the full APS183 video on YouTube →
About the author
Alex is the founder of AusPropertyStrategy, a Sydney-based licensed buyer's agent and property investment strategist with dual master's degrees in accounting and an MBA, and a former general manager of a listed company. For APS183, he went through decades of downturn data for Brisbane, Perth and Adelaide, alongside Cotality's October figures, ABS unemployment and population data, and the RBA's November decision and statement.
What we tested: this fall scored against Sydney's 2017 to 2019 downturn and Perth's 2014 to 2019 downturn on four factors (the cause, jobs and population, who's selling, and the turnaround conditions); Perth's downturns grouped by cause (2008 to 2009, 2010 to 2011 and 2014 to 2019); and what a Perth-style fall did to a hypothetical $600,000 home bought at the 2014 peak.
About the figures: house price, listing and unsold stock figures are from Cotality, including its October figures released on 2 November. Unemployment and population figures are from the Australian Bureau of Statistics. Mark and Sarah are hypothetical owners, and their numbers are worked examples, not anyone's actual property. This is general information, not financial advice.


