

Is Australia Halfway to a 1991 Recession? Job Losses Have Just Started
Last updated: 2026-11-21
🔑 Key Takeaways (TL;DR)
Households spend almost as much of their income on interest as in 1990: 5.4% in early 2026, against a 5.7% peak then.
Household debt is about 178% of disposable income, against around 54% in 1990.
Unemployment was 4.7% in September 2026, the highest since October 2021.
Three of the four steps to the 1991 recession have played out; job losses have only just started.
Contents
Are Australian Interest Bills Really Back to 1990 Levels?
Why Is a 6% Mortgage Rate as Heavy as 17% Was?
What Were the Four Steps to the 1991 Recession?
How Did Job Losses Turn It Into a Recession?
How Far Did House Prices Fall in the 1991 Recession?
Why Did Melbourne Prices Fall the Most?
Which of the Four Steps Has Australia Already Taken?
Are Banks and Households Ready for a Downturn?
How High Would Unemployment Need to Go to Repeat 1991?
Frequently Asked Questions
What Should Mortgage Holders Check Now?
The share of income Australian households spend on interest is almost back where it was in 1990, and at the end of 2023, it was even higher. Mortgage rates were as high as 17% back then. The last time Australians carried interest bills this heavy, the country went into the 1991 recession, unemployment almost doubled, and in one city, house prices fell for seven years after inflation.
My answer is that Australia is only halfway down the road to a 1991-style recession. Interest bills are already as heavy as back then, but unemployment has only just started to rise. I've gone back through the years from 1987 to 1996 to show why prices held up nationally, and how high unemployment would need to go now. This article is based on my latest AusPropertyStrategy episode. Watch the full APS185 video on YouTube →
Examples are simplified, and this is general information, not financial advice.
Are Australian Interest Bills Really Back to 1990 Levels?
Almost, and at the end of 2023 they went higher. A senior economist at the accounting firm KPMG divided all the interest households pay by all household income, using national accounts data from the ABS. In the first quarter of 1990, interest came to 5.7% of household income, the peak back then.
For every $100 households earned, $5.70 went on interest. In the last quarter of 2023, it hit 5.9%, above the 1990 peak. The latest figure, for the first quarter of 2026, is 5.4%, and since then the RBA has raised rates three more times.
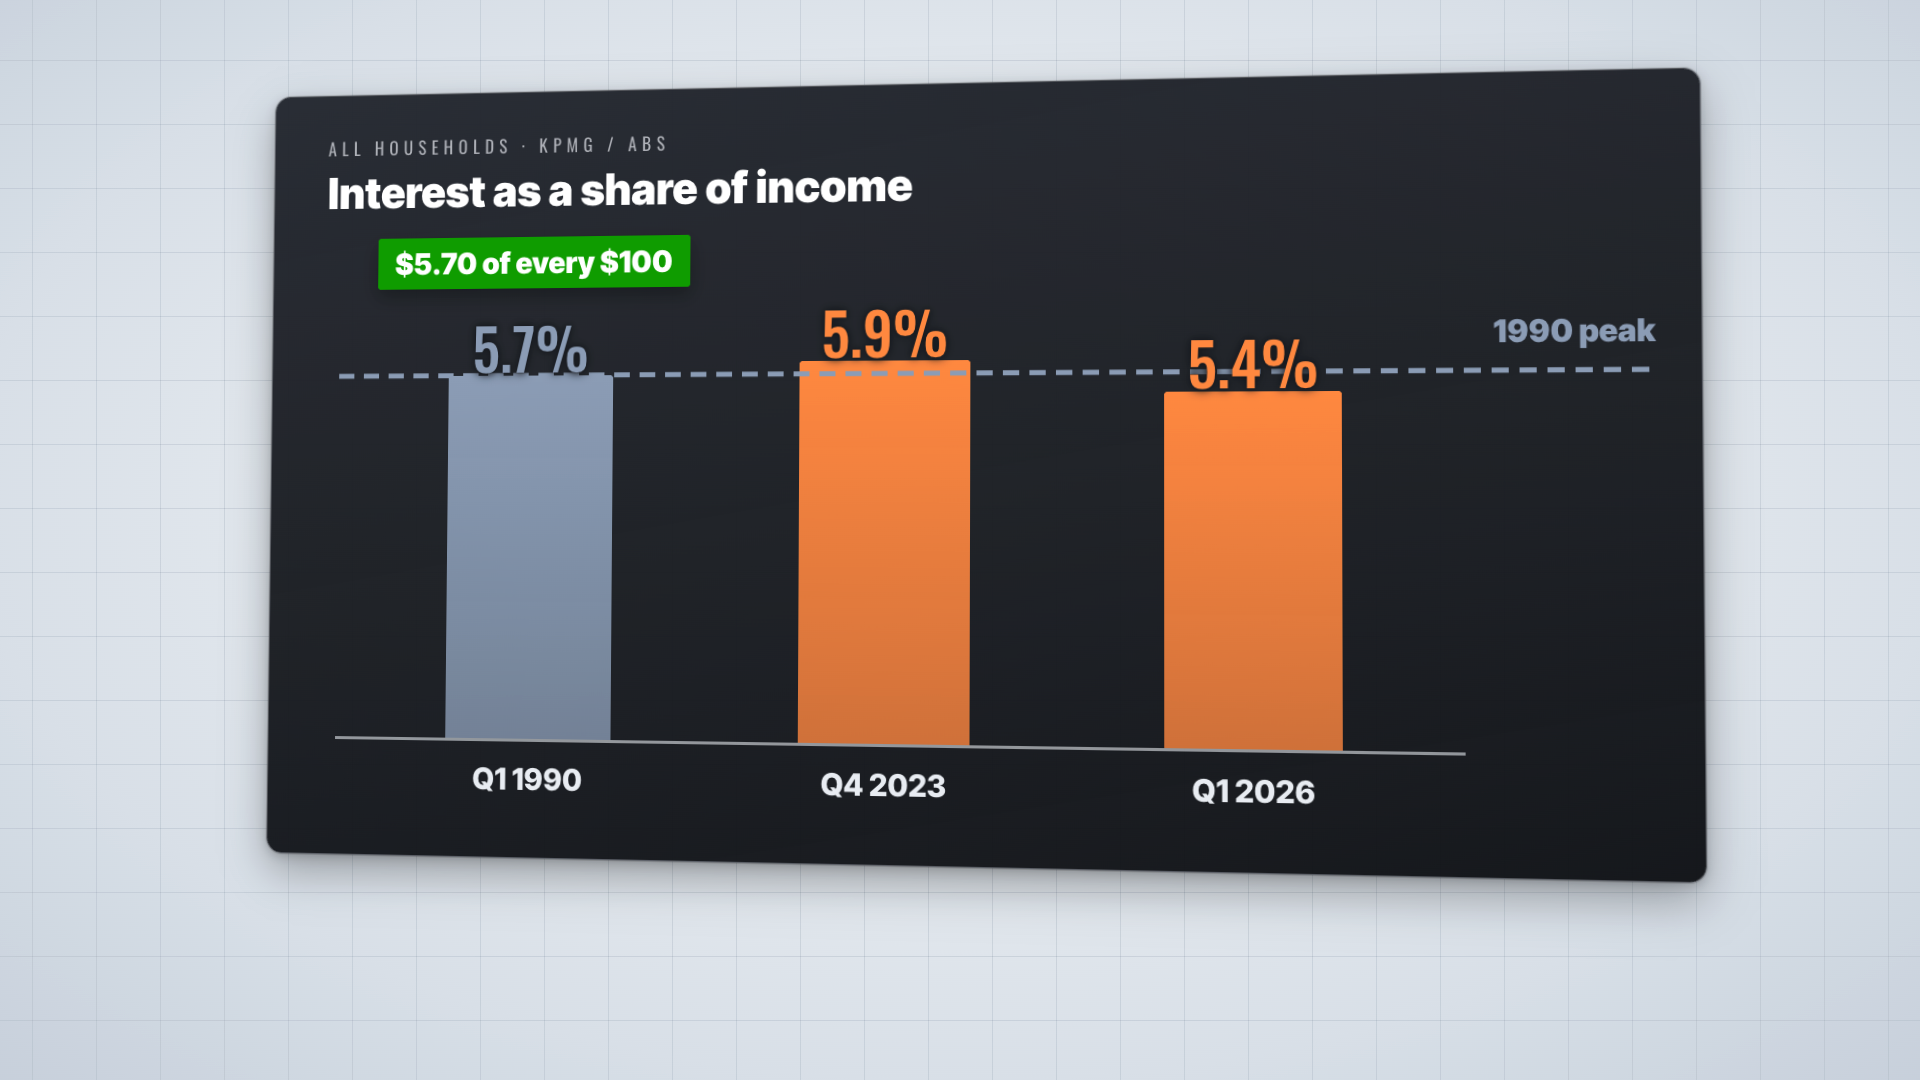
The figures came out on 2 July 2026, and the three hikes since the first quarter aren't fully counted yet. Once the next national accounts come out, the figure could go back above the 1990 peak.
Is 5.7% really that high? It is, because averaging pulls the figure down in three separate ways. First, households with no mortgage are included, and they pay almost no interest. Second, it only counts interest, not the principal you pay off each month. Third, it divides by the income of every household, high earners included.
For households with a mortgage, the pressure is much heavier than the average suggests. That's why I don't read 5.4% as a comfortable number, because it blends in households that barely feel a rate rise at all.
Period | Interest as a share of household income | Note |
First quarter of 1990 | 5.7% | The peak back then |
Last quarter of 2023 | 5.9% | Above the 1990 peak |
First quarter of 2026 | 5.4% | Three RBA hikes since then not fully counted |
Why Is a 6% Mortgage Rate as Heavy as 17% Was?
Because we borrow far more. In 1989, mortgage rates were 17%, and today they aren't even half that, yet the interest burden is almost the same. In round numbers, the rate is about a third of what it was, but the loan is three times bigger, so the interest comes out about the same.
Back then, a buyer could borrow $100,000 at 17%, which is $17,000 a year in interest. Today, a buyer could borrow $300,000 at 6%, which is $18,000 a year. Relative to income, households now owe more than three times what they did back then.
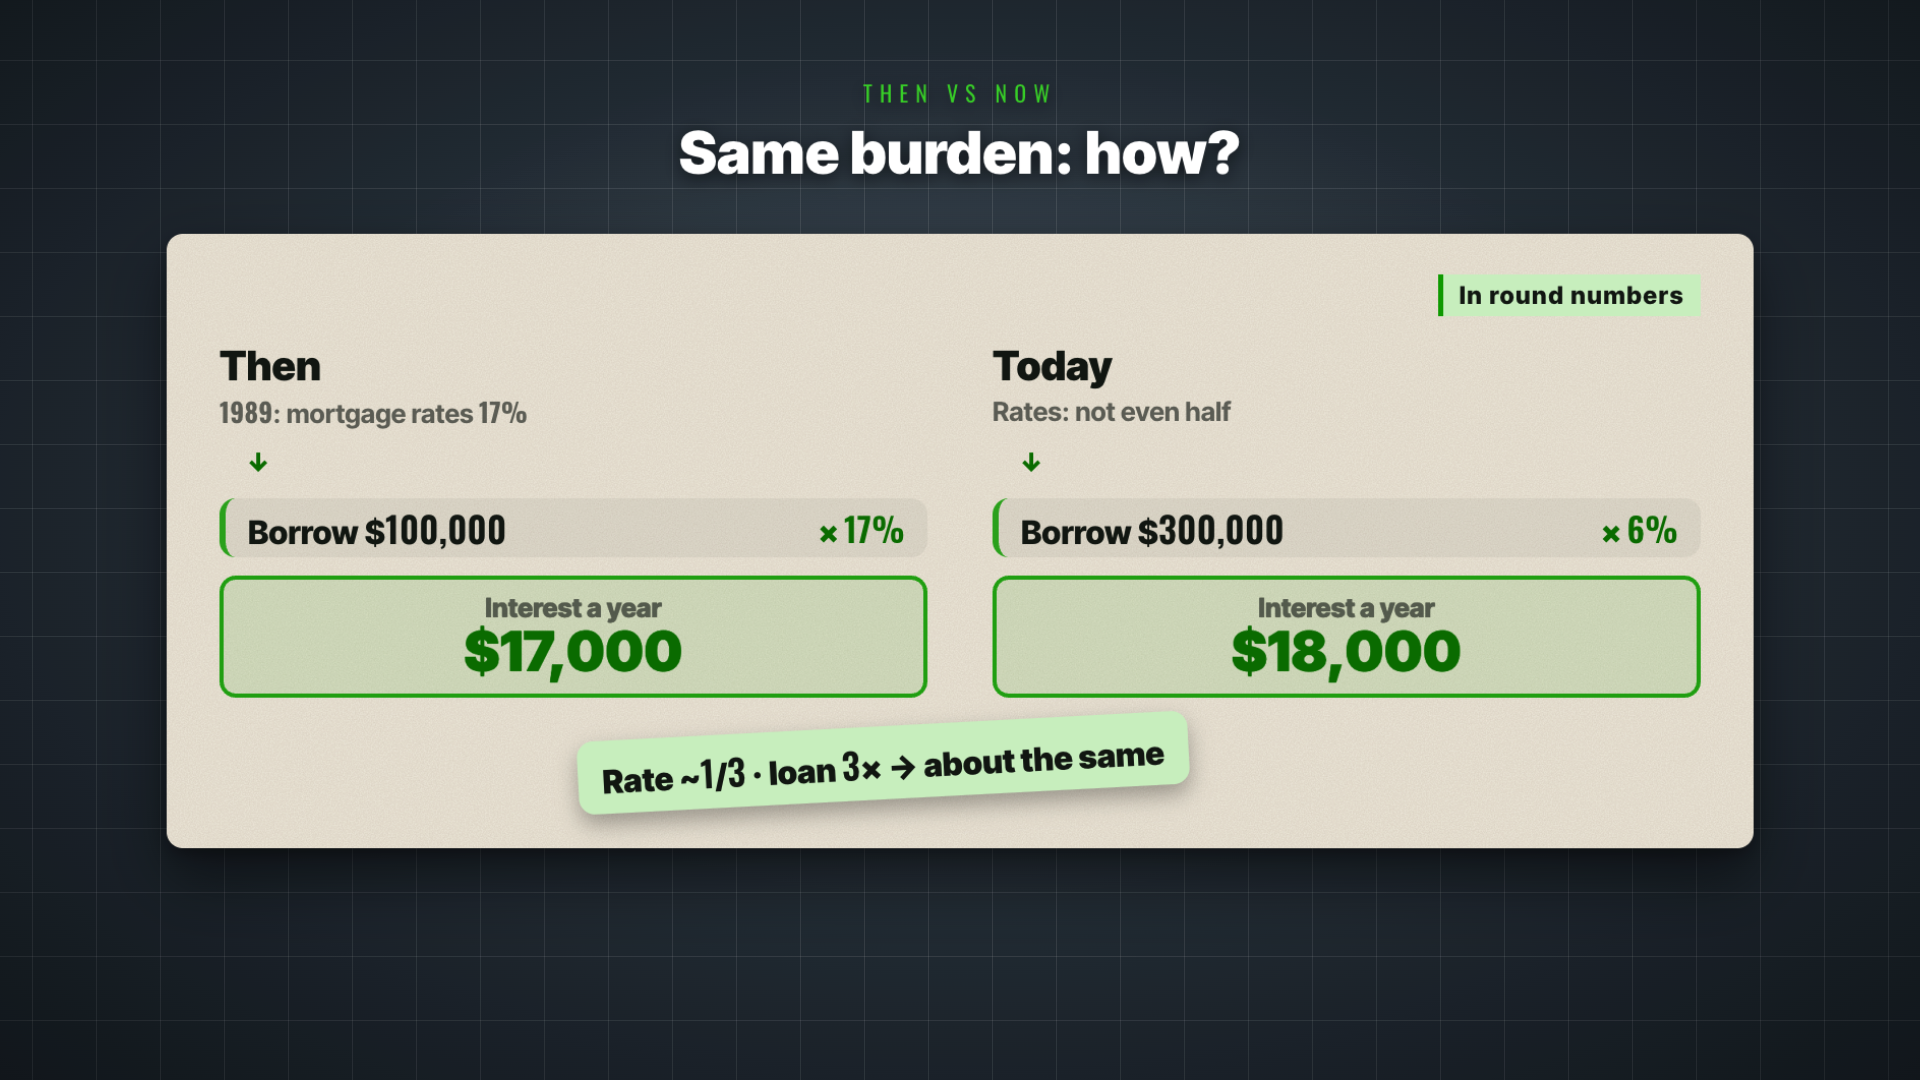
The bigger loan also changes how much each rate rise hurts. Back then, a 1% rise on a $100,000 loan cost an extra $1,000 a year. Today, on $300,000, the same 1% rise costs an extra $3,000 a year.
That's why a smaller run of rate hikes can do as much damage as a bigger one did. From 1988, the cash rate went up by about 7%, and this year's hikes are only about a fifth of that. The increase is smaller, but the debt behind it is bigger.
The way I see it, the rate on its own tells you very little. What matters for a household is the rate multiplied by the size of the loan, and on that measure, today's borrowers are carrying almost the same load as borrowers did at the 1990 peak.
Example | Back then | Today |
Typical loan and rate | $100,000 at 17% | $300,000 at 6% |
Yearly interest | $17,000 | $18,000 |
Cost of a 1% rate rise | An extra $1,000 a year | An extra $3,000 a year |
What Were the Four Steps to the 1991 Recession?
Australia went from 1987 to a recession in about four years, in four steps: people borrow to buy and prices rise, rates go up, interest bills get heavier, and then jobs go. It started with negative gearing, which lets you claim a loss on a rental property against your wage income.
In July 1985, the first limit on negative gearing came in, for properties bought after that. Two years later, on 15 September 1987, the limit was scrapped, and buying a rental property suddenly made sense again. Investor borrowing jumped, and the investor share of all housing loans went from 13% to 34% by January 1989.
With that many buyers, national house prices rose 56% between June 1987 and June 1989, or 35% after inflation. A $100,000 house became a $156,000 house in two years, and people rushed even harder to get in. That was step one.
With housing that hot, the RBA stepped in, and step two was rate hikes. The banks' standard variable rate went from 13.5% in June 1988 to 17% in June 1989.
With rates that high, step three followed. Interest bills got heavier and peaked at 5.7% of household income in early 1990, the figure today's households are now close to again.
I keep these steps in order because each one set up the next. It's also the order I use later in this article to check where Australia sits today.
Step | What happened | When |
1. Borrow to buy, prices rise | Investor share of housing loans 13% to 34%; national prices up 56%, or 35% after inflation | September 1987 to June 1989 |
2. Rate hikes | Standard variable rate from 13.5% to 17% | June 1988 to June 1989 |
3. Interest bills peak | 5.7% of household income | Early 1990 |
4. Job losses | Unemployment from 5.8% to 11.2% | December 1989 to December 1992 |
How Did Job Losses Turn It Into a Recession?
When the September quarter national accounts were released on 29 November 1990, the Treasurer, Paul Keating, came out with the famous line, "This is the recession that Australia had to have." As the economy shrank, step four arrived, and that step was job losses.
Unemployment rose from 5.8% in December 1989 to 11.2% in December 1992, almost double. That means one in nine people who wanted a job couldn't find one. And when you lose your job, your mortgage repayment doesn't drop by a cent.
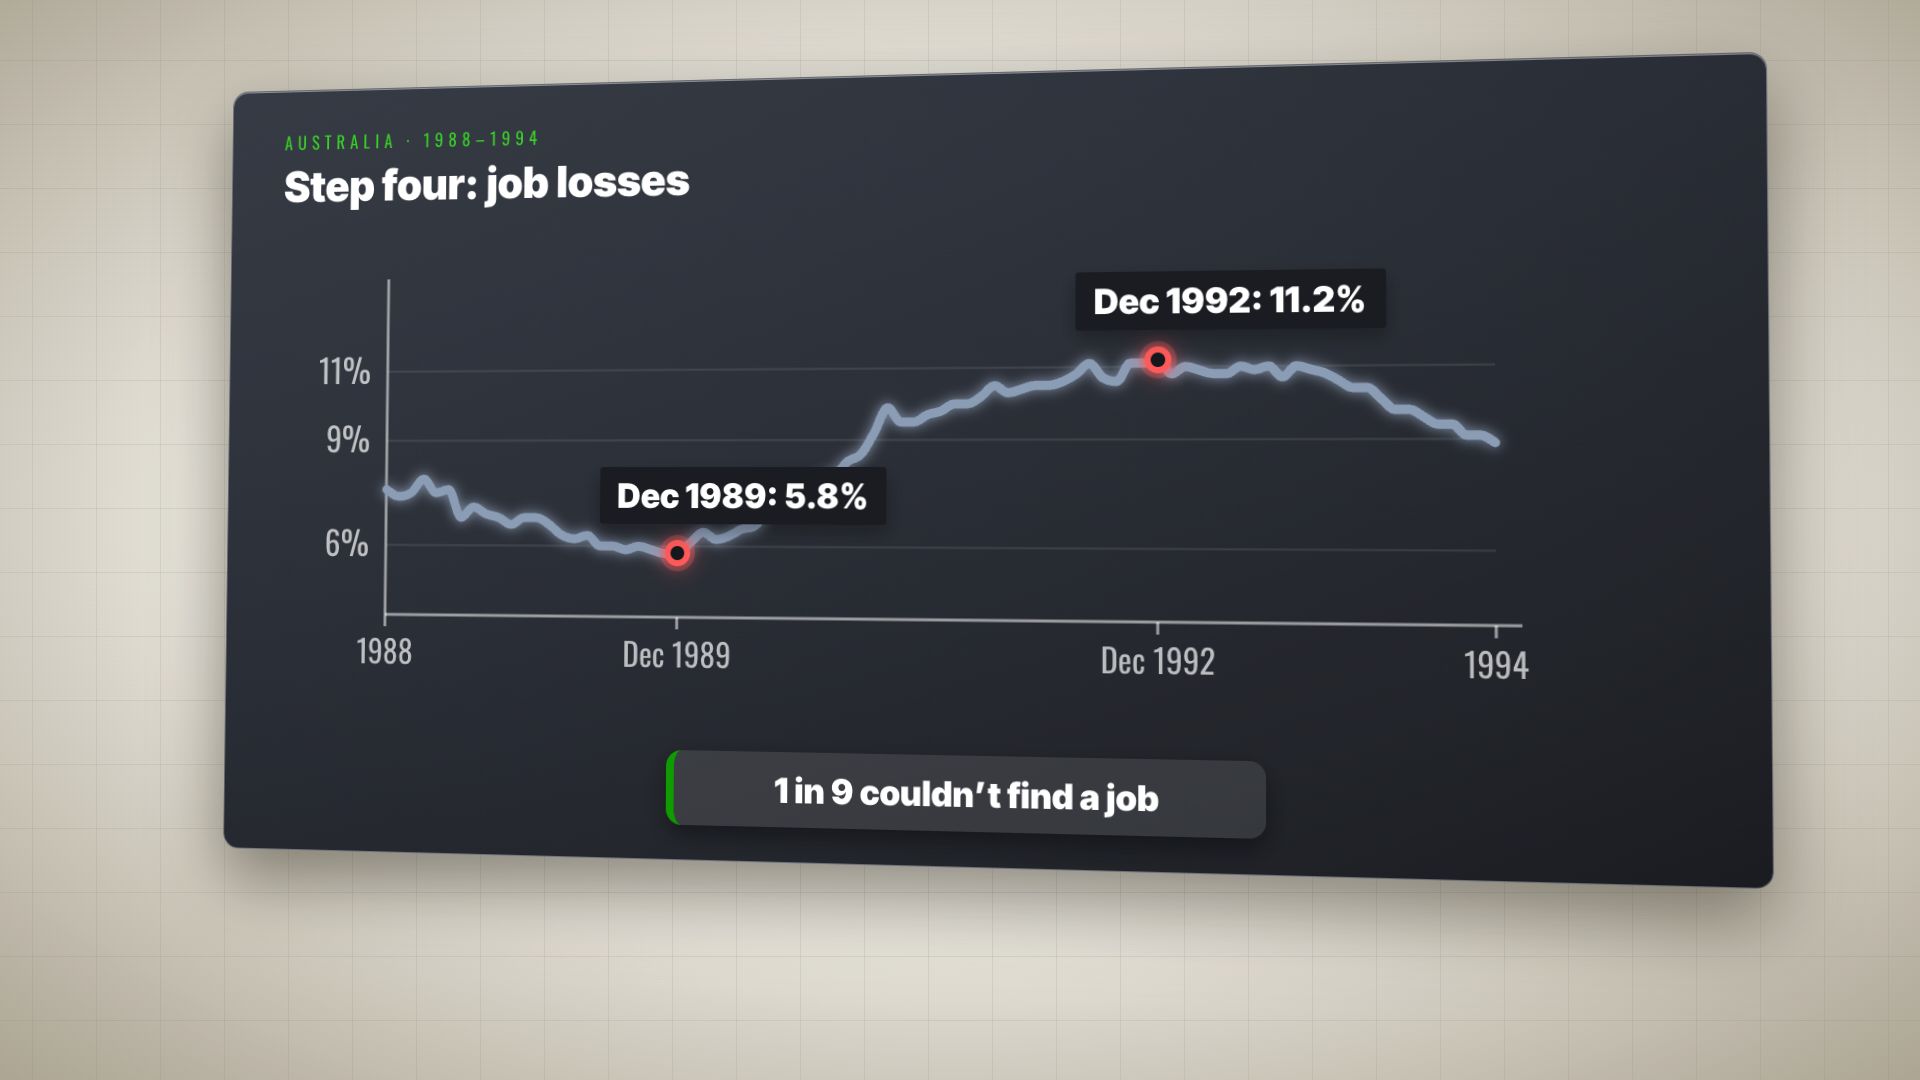
Of the four steps, the fourth hurt households most. When rates are high, you can tighten your belt and get by. When your income stops, there's nothing left to cut.
That's the step I watch most closely, because it decides whether people are forced to sell. Whether you can keep paying your mortgage depends mostly on whether you have a job. Where unemployment is high, mortgage arrears, meaning people falling behind on repayments, are high too.
Arrears in the early 1990s were much higher than in 2019 because unemployment was so high. High rates squeeze a household, but job losses are what turn that squeeze into a forced sale, and a wave of forced sales is what pushes prices down hard.
How Far Did House Prices Fall in the 1991 Recession?
Less than you'd expect across the country. After inflation, national house prices fell about 8% between March 1989 and December 1990. That doesn't sound like much, but it took ten years for prices to recover. Melbourne was different: after inflation, its house prices fell 22% between March 1989 and March 1996.
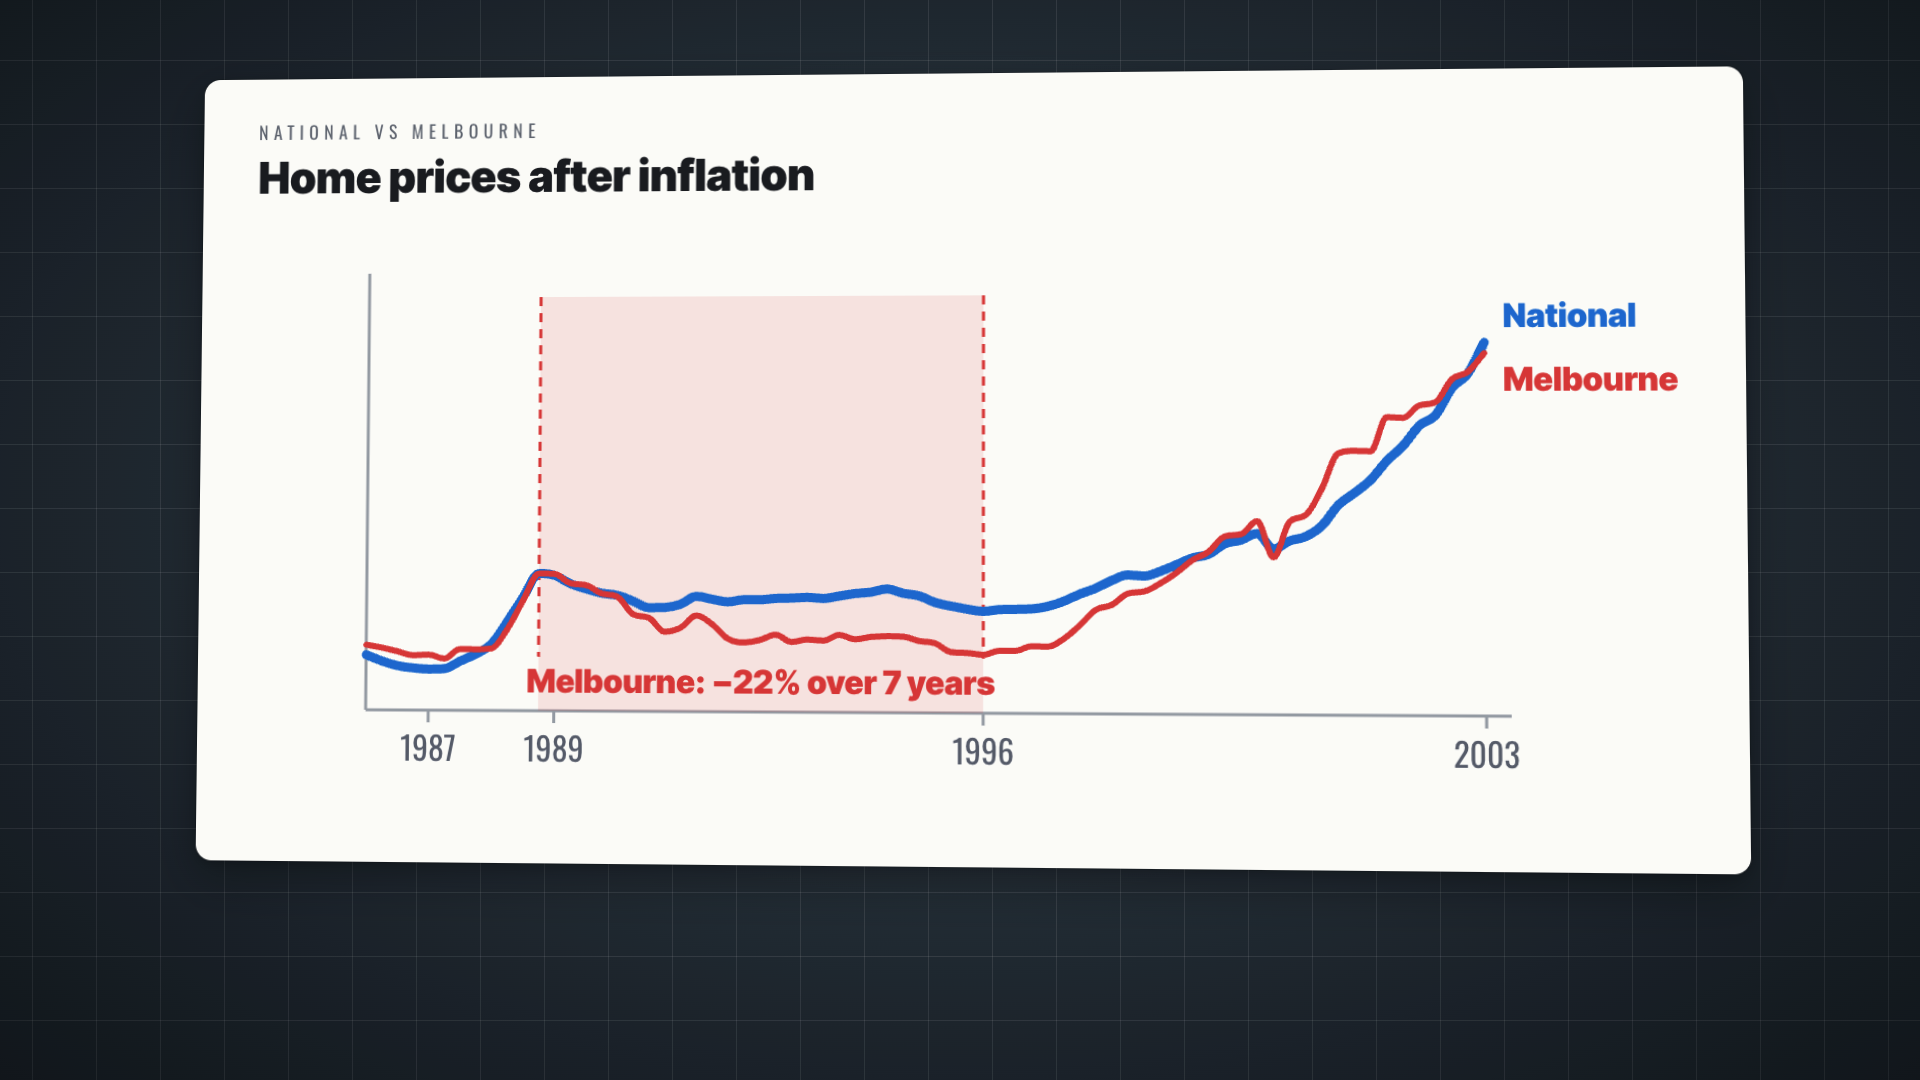
With rates that high and unemployment in double digits, why didn't national prices fall sharply? Put simply, most households with a mortgage held on and weren't forced to sell. Prices only fall hard when a lot of people are desperate to sell at once.
As long as they can make their repayments, most people won't sell. That held the national fall to about 8% after inflation, even with mortgage rates at 17% and one in nine people who wanted a job unable to find one.
The Melbourne figure comes from a 2003 housing review by the federal Treasury. A 22% fall after inflation over seven years is a very different experience from 8% nationally, and the reasons were specific to Victoria, which I cover in the next section.
The lesson I take from this is that the national number hid a lot. Back then, national prices held up because most households didn't owe much, and however high the rate, the loan behind it was small. Today, that's exactly what has changed.
Market | Fall after inflation | Period |
National house prices | About 8%, then ten years to recover | March 1989 to December 1990 |
Melbourne house prices | 22% | March 1989 to March 1996 |
Why Did Melbourne Prices Fall the Most?
Frozen deposits, a bank in trouble and the most job losses all landed on Victoria at once. In 1990, a building society in Geelong, southwest of Melbourne, was hit by two bank runs and froze every account. The state later guaranteed the deposits, but the last of the money wasn't paid out until August 1995.
Around the same time, the government-owned State Bank of Victoria lost about $2.7 billion through its business lending arm. The bank didn't go under, and in 1990 the state sold it to the Commonwealth Bank. With all three hitting together, it's no surprise Melbourne prices fell the most.
The Geelong depositors waited years for their money and lost out on interest along the way. For those years, money people had saved was locked up, right when jobs were disappearing.
The recovery came when the RBA cut the cash rate by more than 10% in total, down to 4.75% by July 1993. Mortgage rates followed, repayments got lighter, and buyers slowly came back.
My read is that Melbourne shows what happens when job losses and lender trouble arrive together. Today, with APRA watching the banks, I think the chance of lenders getting into that kind of trouble is very low. That leaves unemployment as the one factor that can drive what happens next.
What hit Victoria | Detail | Outcome |
Building society in Geelong | Two bank runs in 1990; every account frozen | State guaranteed the deposits; last money paid out in August 1995 |
State Bank of Victoria | Lost about $2.7 billion through its business lending arm | Sold to the Commonwealth Bank in 1990 |
Job losses | The most job losses landed on Victoria | Melbourne prices fell 22% after inflation |
RBA rate cuts | Cash rate cut by more than 10% in total | Down to 4.75% by July 1993; buyers slowly came back |
📌 Thinking about your own situation?
Book a free 15-minute call with one of our property investment strategists and get a straight answer, no strings. For the full done-for-you path, from strategy, lending and property selection to portfolio, tax structure and wealth planning, book a free 30-minute Discovery Session and see how VISION Gold Membership works.
Which of the Four Steps Has Australia Already Taken?
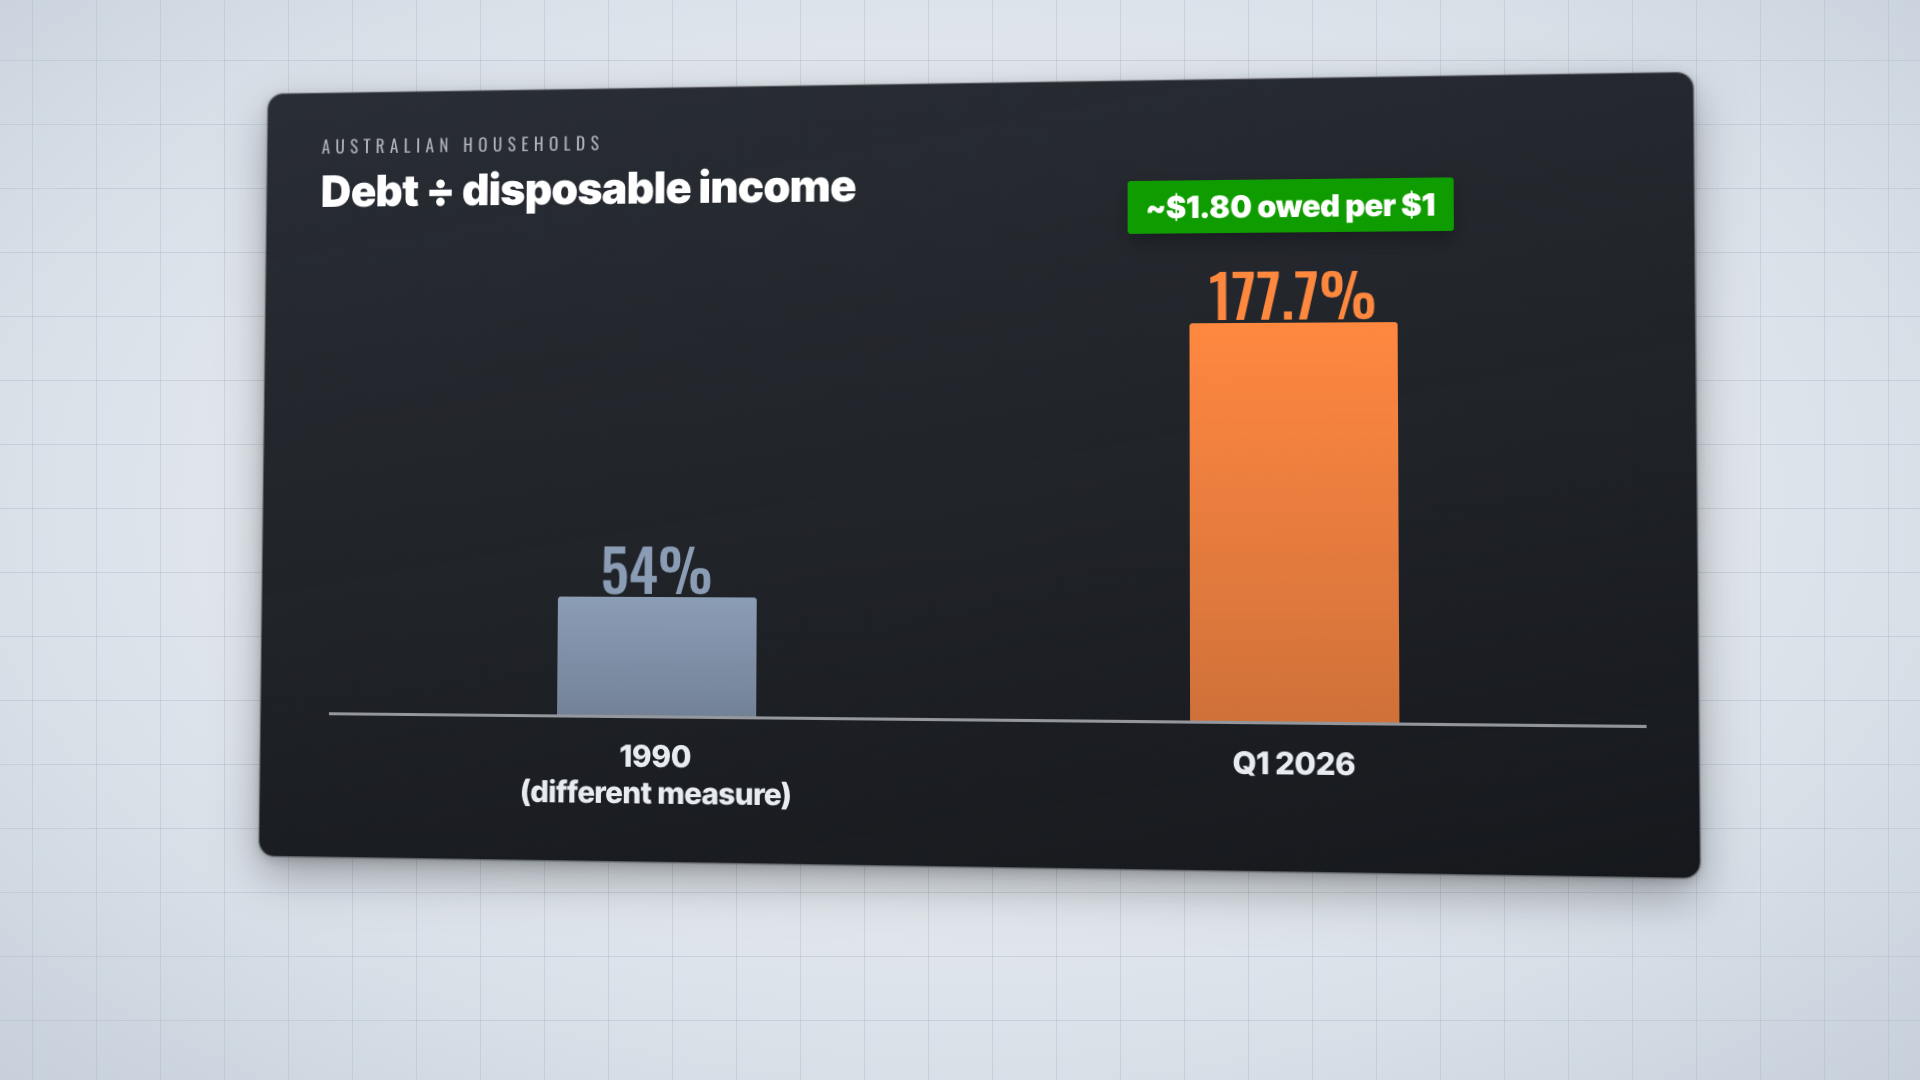
The first three. Step one, borrowing to buy, is here: in the first quarter of 2026, household debt was about 178% of disposable income, which is what you can spend after tax. So for every dollar you can spend, you owe almost $1.80. Back in 1990, it was only around 54%.
Step two, rate hikes, is here too, just smaller: the RBA has raised rates five times this year, taking the cash rate to 4.85%. Step three, the interest burden, arrived early: by the end of 2023, the share of household income going on interest had already passed its 1990s peak.
House prices rose strongly over the last few years and peaked in March 2026. Cotality data shows that by the end of October, national house prices were 6.7% below that peak after seven months of declines, and some capital cities are seeing their fastest downturns in 40 years. Back then, Melbourne prices fell for seven years after inflation. Today we're seven months in, and we can't tell yet whether this will last for years.
One reason for this downturn is the exact opposite of 1987. This year, the government changed both negative gearing and the capital gains tax discount, or CGT discount. Both changes were legislated in June 2026 and start on 1 July 2027, so buying an established investment property doesn't add up as well anymore. The RBA's October Financial Stability Review lists this as one reason prices have fallen this year, and new lending is cooling too.
I'm not saying a recession is certain. In June 2008, the interest burden reached 7.9%, worse than today, and Australia still avoided a technical recession.
Step | Early 1990s | Now |
1. Borrowing to buy | Household debt around 54% of disposable income (1990) | About 178% (first quarter of 2026) |
2. Rate hikes | Cash rate up about 7% from 1988 | Five hikes this year; cash rate 4.85% |
3. Interest burden | Peaked at 5.7% of income in early 1990 | 5.9% at the end of 2023; 5.4% in early 2026 |
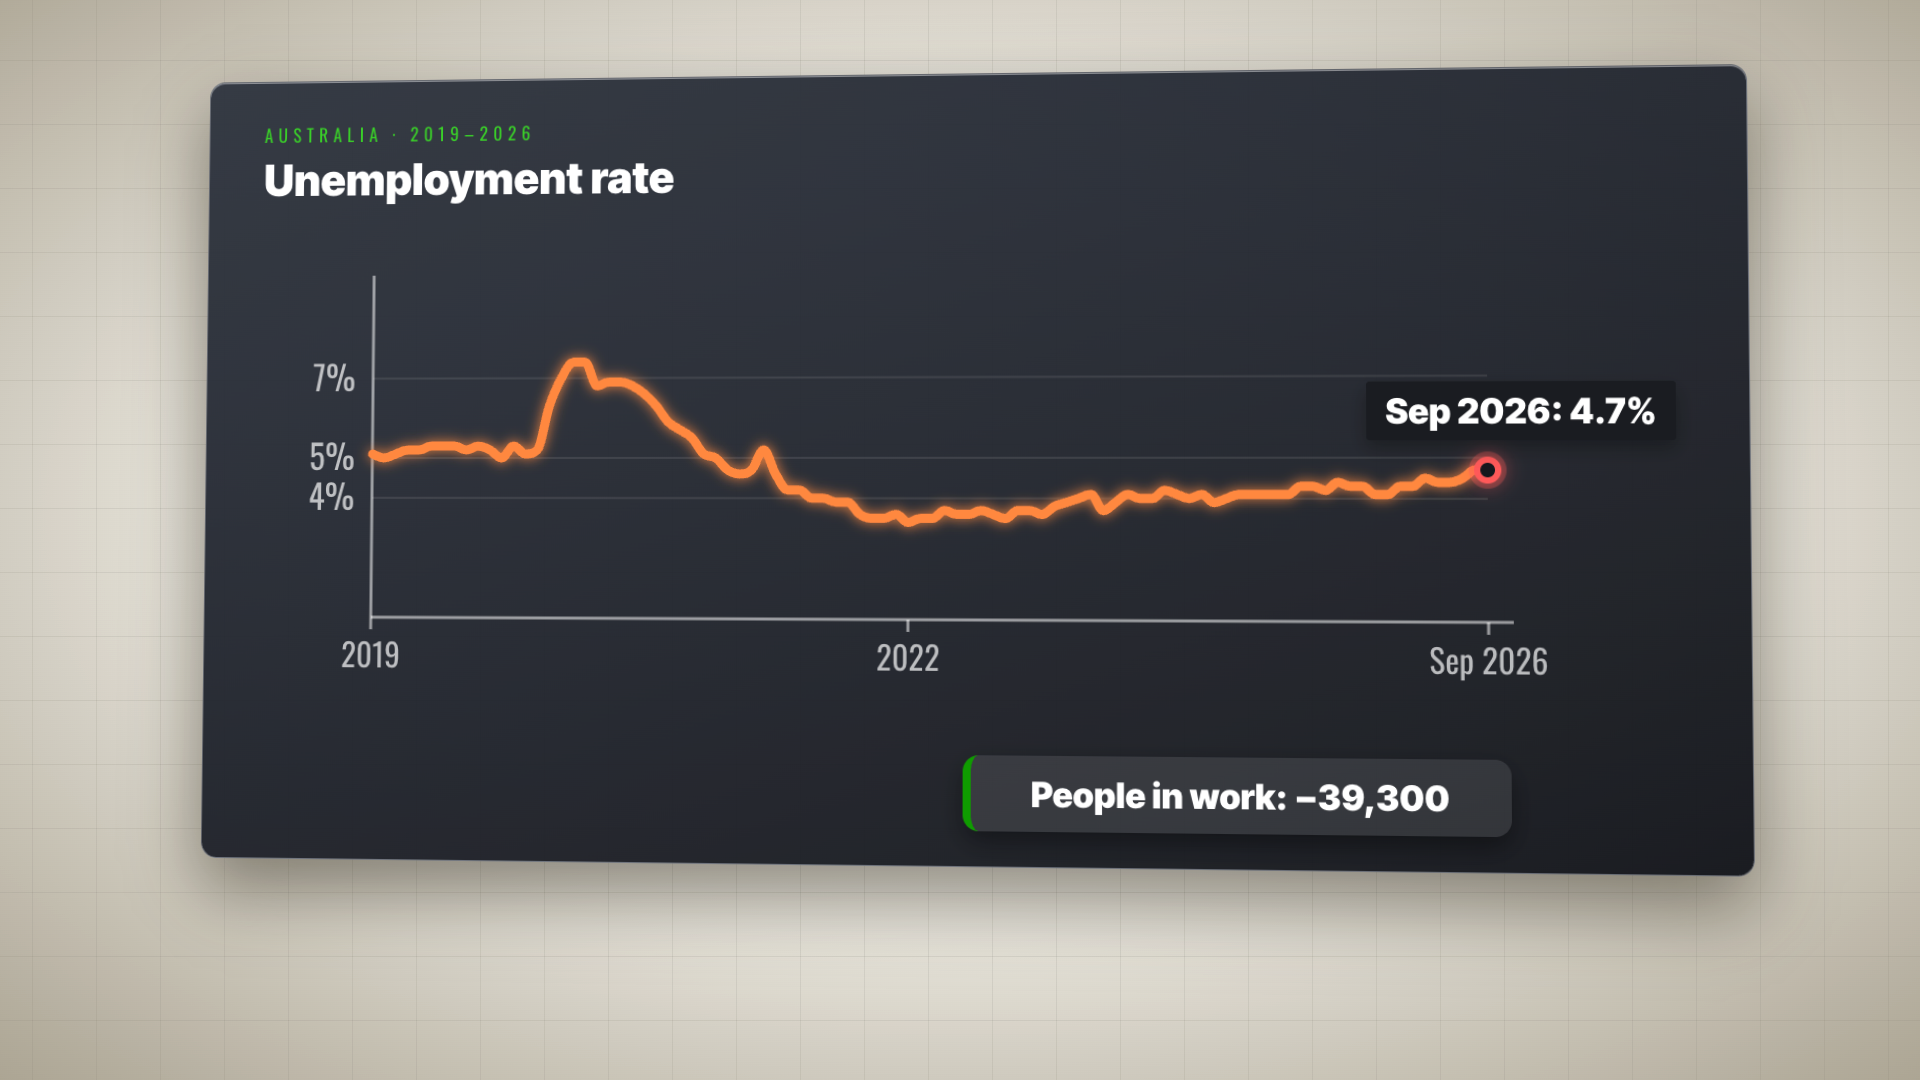
4. Job losses | Unemployment from 5.8% to 11.2% | 4.7% in September 2026, only just started rising |
Are Banks and Households Ready for a Downturn?
The banks are better protected than in the 1990s. In the early 1990s, Australia's banks had their biggest losses in almost a century. Today, the RBA's October review states that even in a very bad downturn, the banks have enough capital to keep lending.
There's also an extra safeguard we didn't have then. The bank regulator, APRA, was only set up in 1998, and it requires banks to check whether you could still afford your loan at a rate 3% above the one you'll actually pay. In May 2026, APRA kept that serviceability buffer at 3%.
Households are stretched, but most still have savings. Fewer than 1% of borrowers are in negative equity, which means selling the home wouldn't clear the loan. That's fine while you can make your repayments, but if you lose your job and need to sell, it puts you in a much tougher position.
At least half of all borrowers have enough put aside to cover more than a year of repayments. Among owner-occupiers on variable rates, about 2% don't earn enough to cover their repayments and essential spending, and most of them have savings to fall back on for more than six months.
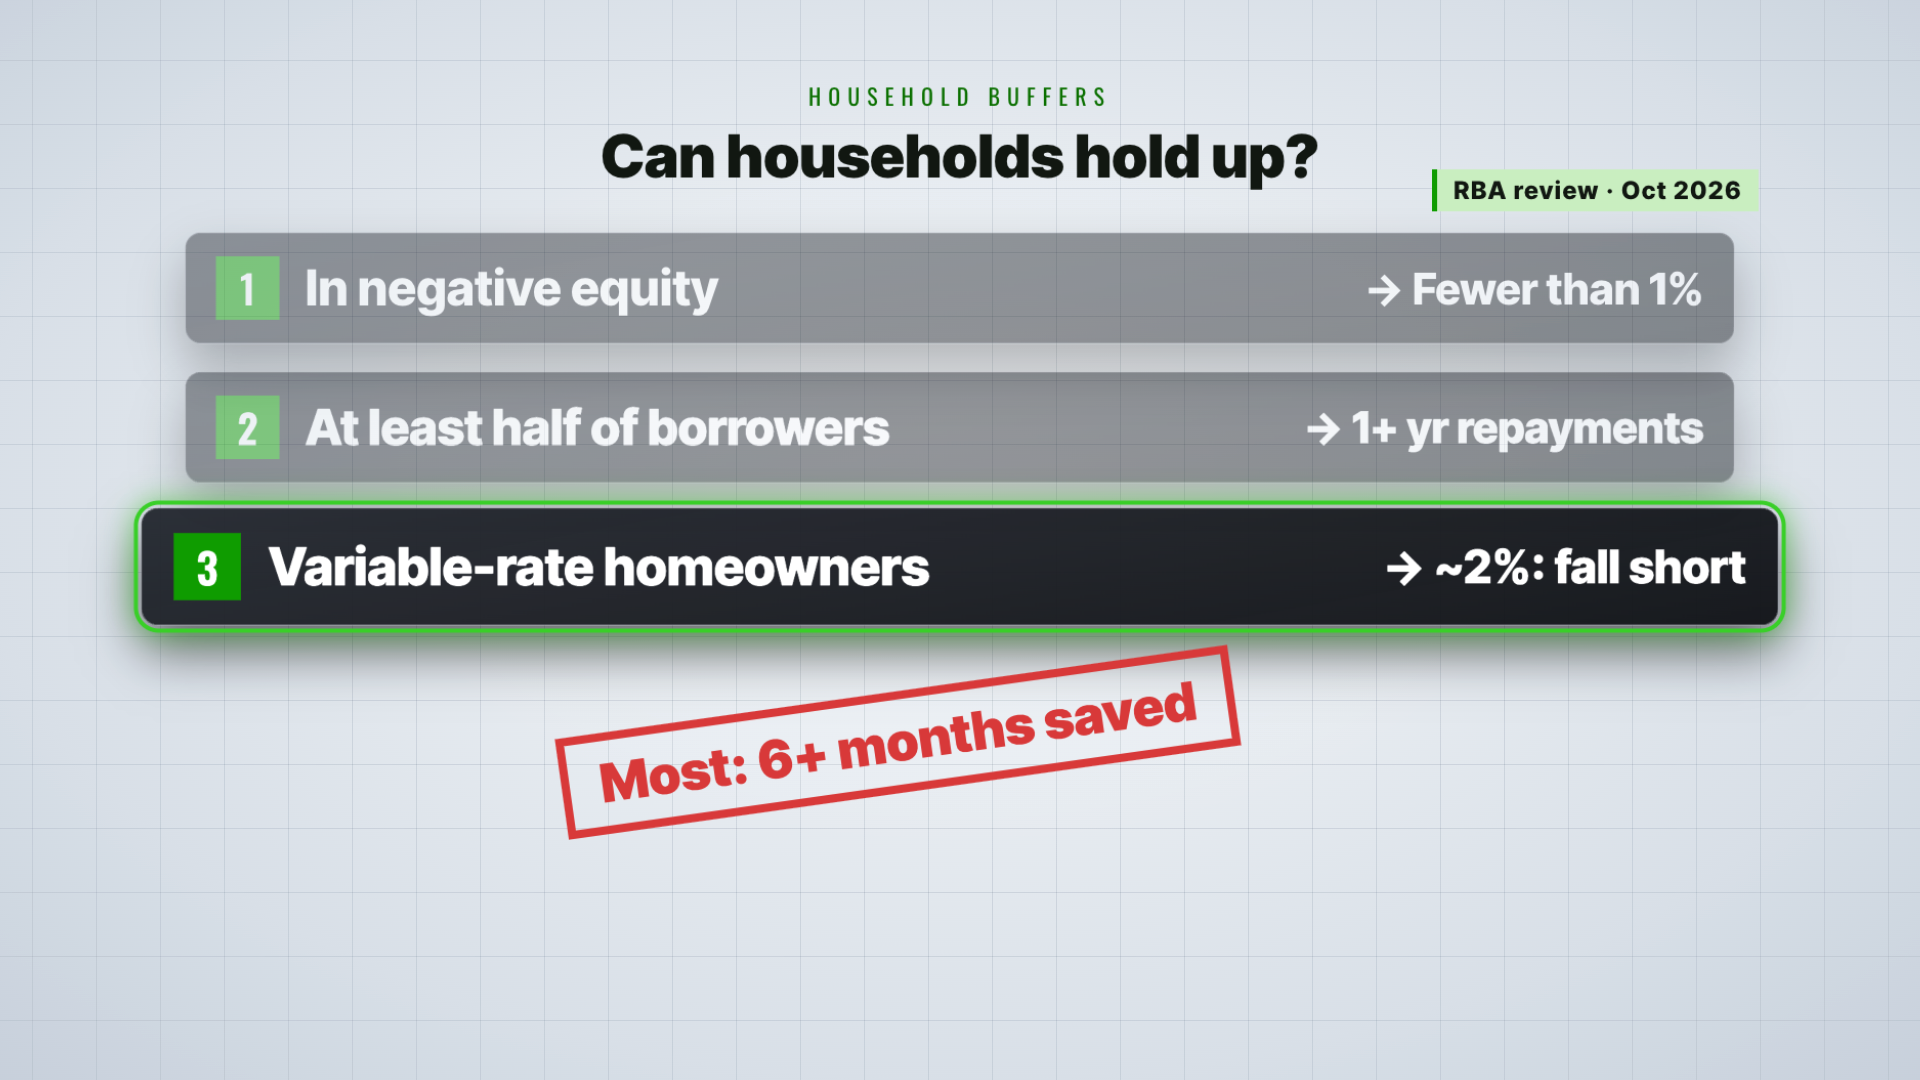
Who's finding it hardest? It's people who borrowed during the COVID years, especially those who locked in a low fixed rate for several years and have only recently rolled off it. Their repayments jumped all at once, and the RBA also notes that banks approved loans more loosely in those years. Only one thing could eat through these savings, and that's losing your job.
Measure | What the October review and APRA show | Why it matters |
Bank capital | Enough to keep lending even in a very bad downturn | Lender trouble was a big part of 1990s Melbourne |
Serviceability buffer | 3% above the actual rate, kept in May 2026 | Borrowers were tested against higher rates |
Negative equity | Fewer than 1% of borrowers | Bites only if you have to sell |
Savings buffers | At least half have more than a year of repayments put aside | Time to get through a job loss |
Monthly shortfalls | About 2% of variable-rate owner-occupiers; most have over six months of savings | The group to watch if unemployment rises |
How High Would Unemployment Need to Go to Repeat 1991?
Back then, unemployment rose from 5.8% to 11.2%, an increase of more than 5%. Today it's 4.7%. A bit over half that rise would take it to 8%, and the full rise to around 10%. The RBA's own warning line for unemployment is 5.1%, and on the current trend, I think it really could go above that.
The ABS says unemployment was 4.7% in September 2026, the highest since October 2021, and the number of people in work fell by about 39,300 that month. Whether households keep paying their mortgages depends mostly on jobs, so this is the number that decides what happens next.
The RBA has also run a stress test, which checks how banks and households would hold up in a very bad situation. In the October review, it assumed unemployment rises to 6.3%, house prices fall another 20%, inflation hits 7% and the cash rate goes to 5.6%. That's an extreme scenario.
In that scenario, about 5% of mortgaged households wouldn't earn enough to cover their repayments and living costs. Falling short each month isn't the same as defaulting, and two-thirds of them have savings to last more than six months. Even with prices down another 20%, very few households would end up in negative equity.
The RBA's two biggest worries for a shock are overseas: the huge investment linked to artificial intelligence, and a sudden jump in global bond yields. Either would reach households through interest rates and jobs.
Stress test item | Assumption or result | Today |
Unemployment | Rises to 6.3% | 4.7% in September 2026 |
House prices | Fall another 20% | 6.7% below the March 2026 peak (end of October) |
Cash rate | Goes to 5.6% | 4.85% |
Mortgaged households short each month | About 5%; two-thirds have more than six months of savings | Owner-occupiers on variable rates: about 2% |
Frequently Asked Questions
Are Australian households paying as much interest as in 1990?
Almost. Interest took 5.7% of household income in the first quarter of 1990, the peak back then. It hit 5.9% in the last quarter of 2023 and was 5.4% in the first quarter of 2026. The RBA has raised rates three more times since then, and those hikes aren't fully counted yet.
What caused the 1991 recession in Australia?
Four steps over about four years. The negative gearing limit was scrapped in September 1987 and investors borrowed heavily, prices rose 56% in two years, the standard variable rate reached 17%, interest bills peaked at 5.7% of income, and unemployment then rose from 5.8% to 11.2%.
How much did house prices fall in the 1991 recession?
After inflation, national house prices fell about 8% between March 1989 and December 1990, and took ten years to recover. Melbourne fell much further: 22% after inflation between March 1989 and March 1996, according to a 2003 housing review by the federal Treasury.
How much do Australian households owe compared with 1990?
In the first quarter of 2026, household debt was about 178% of disposable income, the money you can spend after tax. That's almost $1.80 owed for every dollar you can spend. In 1990, it was only around 54%, so relative to income, households owe more than three times as much.
What unemployment rate would repeat 1991?
Back then, unemployment rose by more than 5%, from 5.8% to 11.2%. From today's 4.7%, a bit over half that rise would take it to 8%, and the full rise to around 10%. The RBA's own warning line for unemployment is 5.1%, which the current trend could take it above.
What can I do if I can't keep up with my mortgage?
You can ask your bank to change your repayments, which is called a hardship variation. That's your right under the law, and the bank has to answer you in writing within 21 days. Check now whether your income covers your repayments and essential spending, rather than waiting until you lose your job.
What Should Mortgage Holders Check Now?
My view is that today's market is only halfway down the road Australia took back then. The first three steps have already played out. Step four, job losses, has only just started, and the forced selling that would follow hasn't happened yet. Back then, Melbourne prices fell the most because unemployment was so high and lenders ran into trouble. Today, with APRA watching the banks, the chance of that is very low, which leaves unemployment as the one factor to watch. If you have a mortgage, don't wait until you've lost your job to check where you stand, and if you really can't keep up, ask your bank for a hardship variation.
Check your income covers repayments and essentials
Count how many months your offset could carry you
Check whether you're in negative equity
Know how to ask for a hardship variation
Be ready for one more rate hike
Watch unemployment against the RBA's 5.1% line
Book your free strategy call today.
Prefer to watch? See the full APS185 video on YouTube →
About the author
Alex is the founder of AusPropertyStrategy, a Sydney-based licensed buyer's agent and property investment strategist with dual master's degrees in accounting and an MBA, and a former general manager of a listed company. For APS185, he went back through Australia's housing cycle from 1987 to 1996 and lined it up against today, alongside KPMG's interest burden figures, ABS national accounts and labour force data, Cotality's October figures and the RBA's October 2026 Financial Stability Review.
What we tested: the share of household income going on interest in 1990, 2023 and 2026; a $100,000 loan at 17% against a $300,000 loan at 6%, and what a 1% rise costs on each; the four steps to the 1991 recession, checked one by one against today; and how high unemployment would need to rise from 4.7% to repeat 1991.
About the figures: the interest burden figures are a KPMG senior economist's calculations from ABS national accounts data, released on 2 July 2026. Unemployment figures are from the ABS, national price figures are from Cotality's October 2026 data, and the Melbourne figure is from the federal Treasury's 2003 housing review. Bank, household and stress test figures are from the RBA's October 2026 Financial Stability Review. The loan examples are simplified. This is general information, not financial advice.


